


The XRP price struggled in the first four months of the year, with every attempt to recover hitting substantial resistance. Ripple was trading at $2.20 on the first day of May, after falling by over 35% from its highest level of the year. This article examines whether one should sell XRP or hold onto it in May.
XRP Price Crashed Despite Good News
The XRP price retreated even as its network recorded some of the best news in the crypto industry in the first four months of the year.
First, the Securities and Exchange Commission (SEC) approved a futures-based exchange-traded fund (ETF). The recently launched Teucrium 2x Long Daily XRP ETF, which has a management fee of 1.89%, has accumulated over $55 million in assets in under a month.
Over ten companies have also applied for a spot XRP ETF, making it one of the most anticipated funds in the crypto industry. Odds that the SEC will approve these ETFs remain above 80%, especially now that crypto-friendly Paul Atkins has become the SEC Chair.
Second, the SEC ended its appeal against Ripple Labs. This enables Ripple to make deals with American companies in the banking and money transfer industries. Most of these firms stayed away from Ripple as its case continued.
Therefore, Ripple will use its solid balance sheet to accelerate its goal of being a viable rival to SWIFT, a network that handles trillions of dollars in payments.
Third, Ripple Labs acquired Hidden Road, a prime broker that handles over $10 billion in transactions daily. It hopes to ultimately integrate these payments into the XRP Ledger, which will help to boost its network and token burns.
Furthermore, the Ripple USD (RLUSD) stablecoin continued to gain market share as it surpassed the $300 million market capitalization milestone. This growth is expected to continue, as Citi estimates that the stablecoin market cap will reach $1.6 trillion by 2030.
Ripple Price Analysis: Sell in May and Go Away?
So, with the XRP price declining despite this good news, the question remains whether to sell in May and make a departure. This is a common phrase that advises investors to sell assets in May to avoid further losses. It is based on the assumption that assets underperform in May and towards the Summer months.
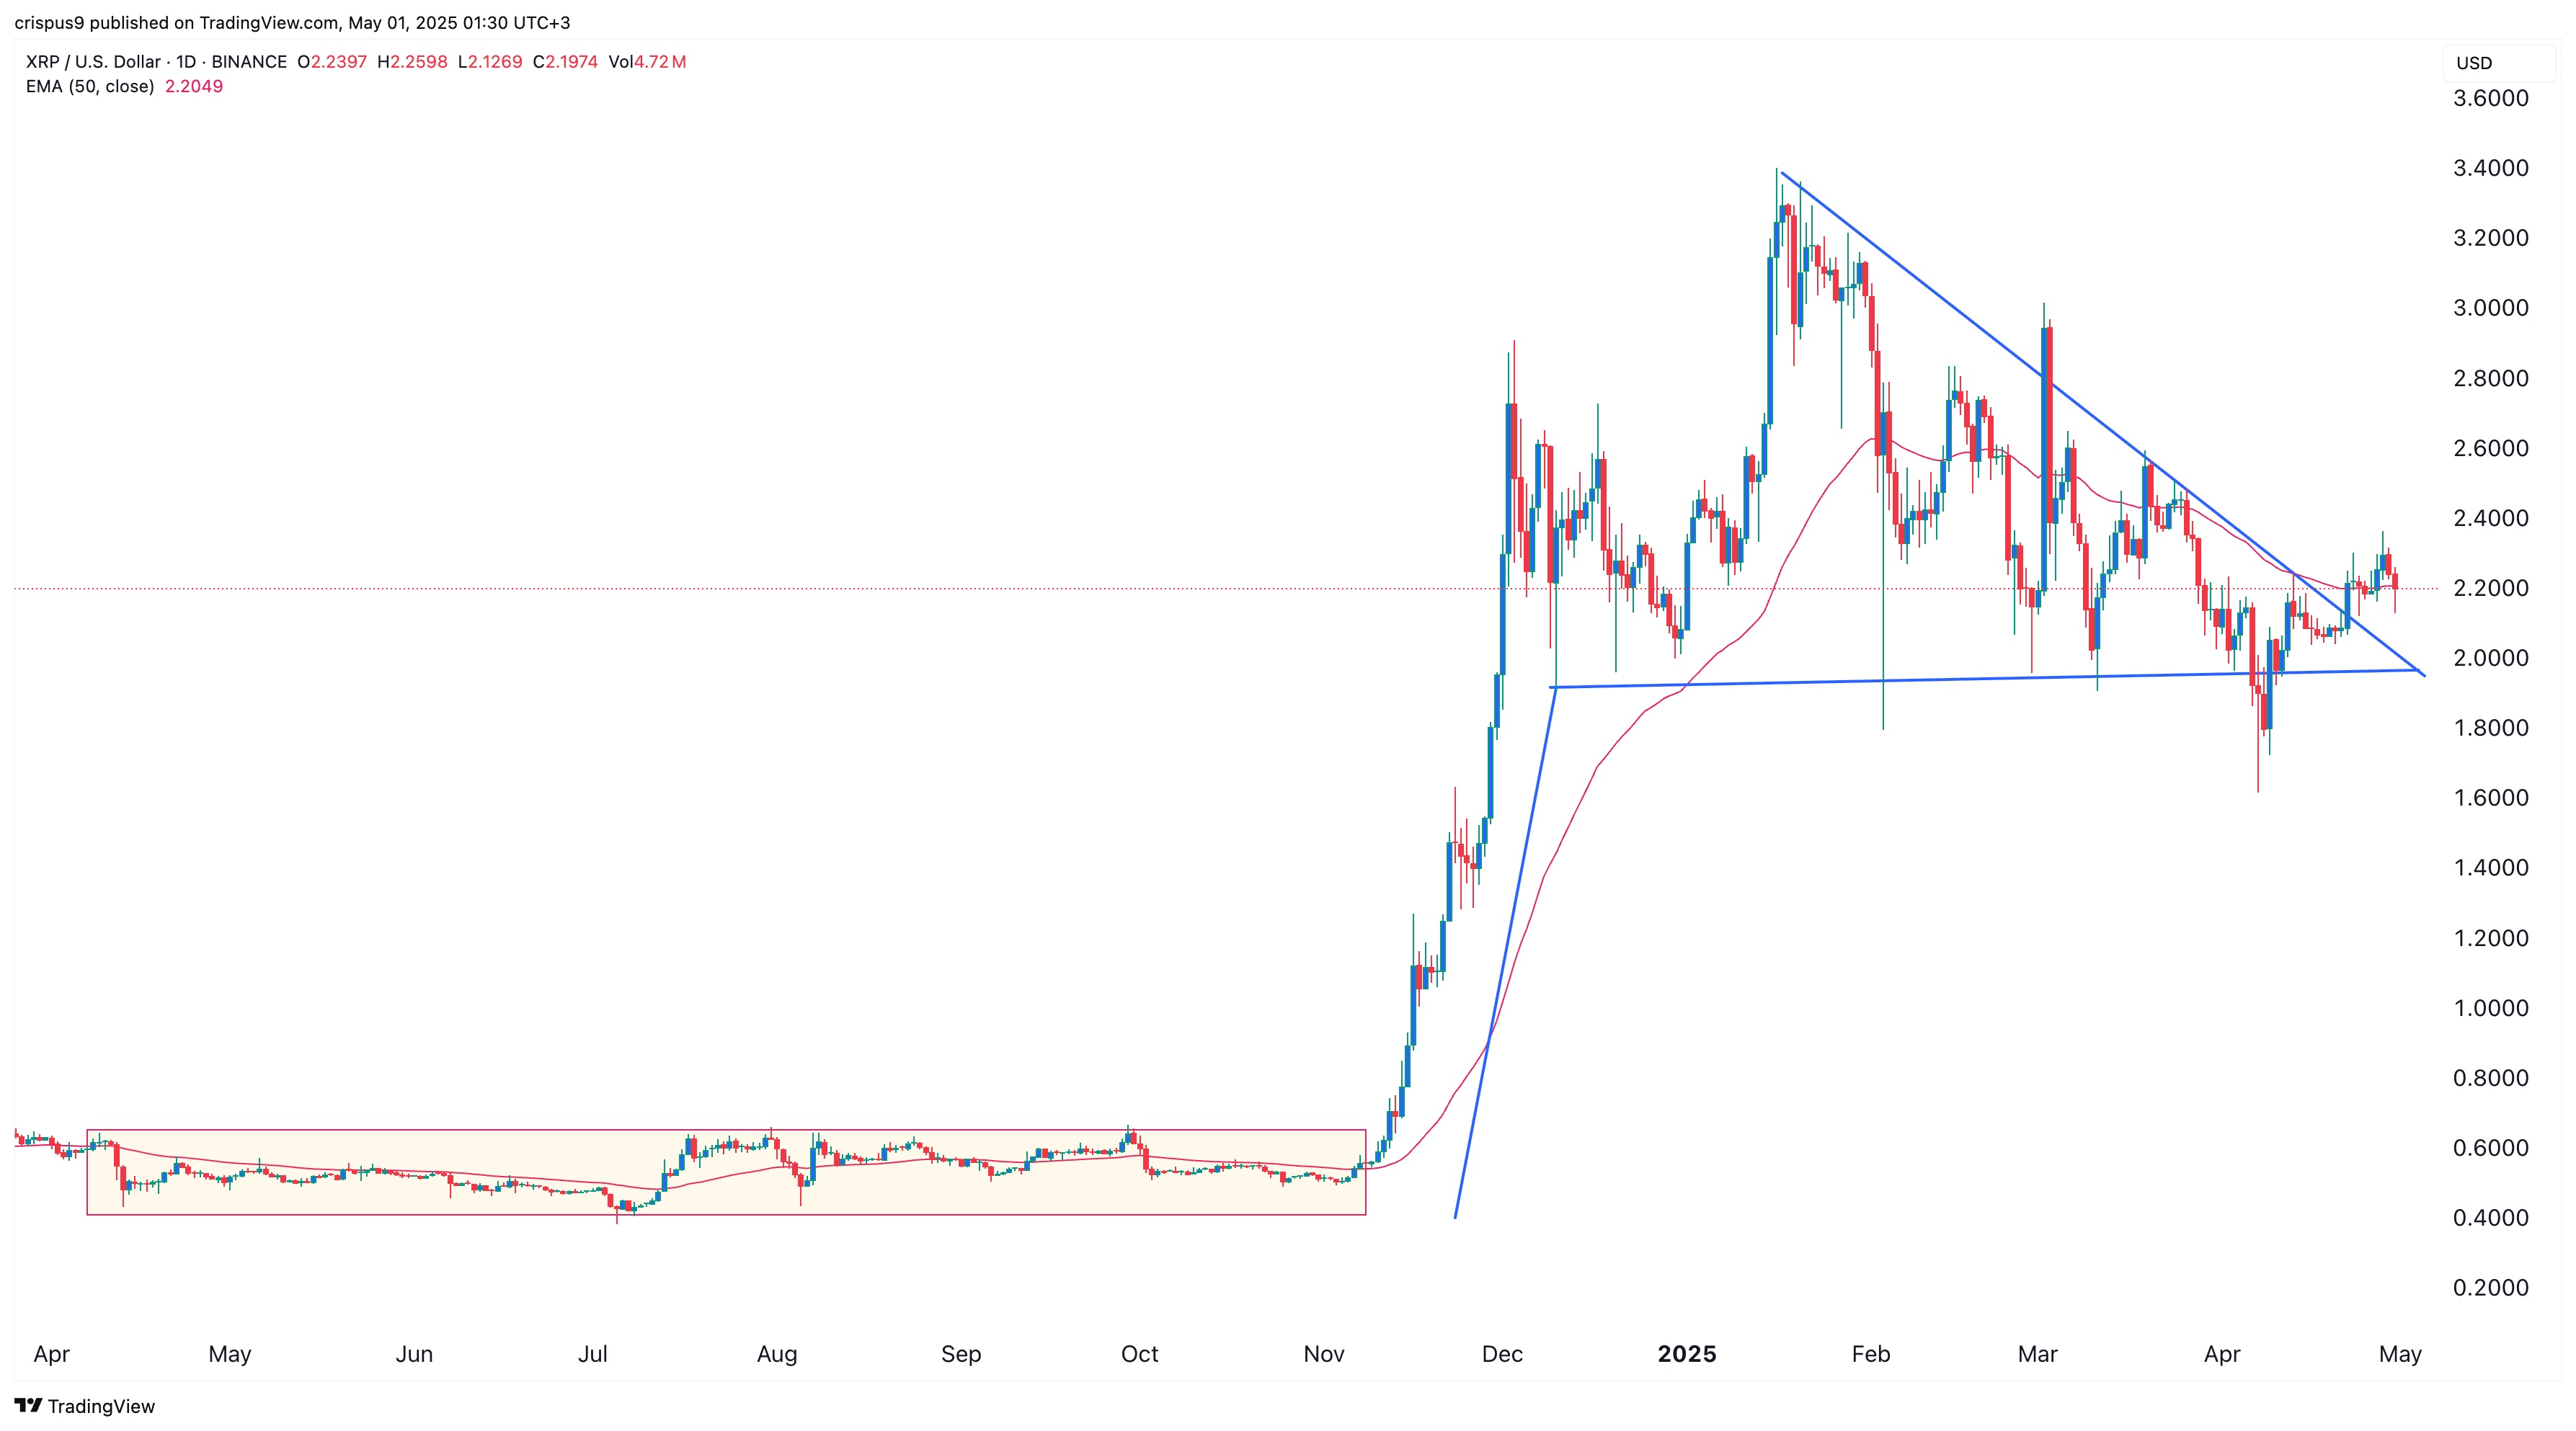
Historical data show that Bitcoin and most altcoins underperformed during this period. For example, as shown in the chart above, XRP price remained in a tight range between May and November when it went parabolic.
However, seasonality concepts don’t always work out as expected. For example, Bitcoin price crashed by 17% in February, even though it is usually its third-best month of the year after October and November.
The daily chart shows that the XRP price has formed a bullish pennant chart pattern, a popular continuation sign in the market. It has moved above the upper side and remained above the 50-day moving average. There is likely potential for a bullish breakout, which could reach $3 soon.
READ MORE: Jasmy Coin Price Prediction: Will JASMY Hit $4 This Cycle?