


The Shiba Inu price remained in a tight range at crucial support this week as demand waned. On Friday, the SHIB coin was trading at $0.00001343, much lower than last November’s high of $0.00003345. A well-known harmonic pattern suggests a future SHIB price increase.
XABCD Pattern Points to a Shiba Inu Price Surge
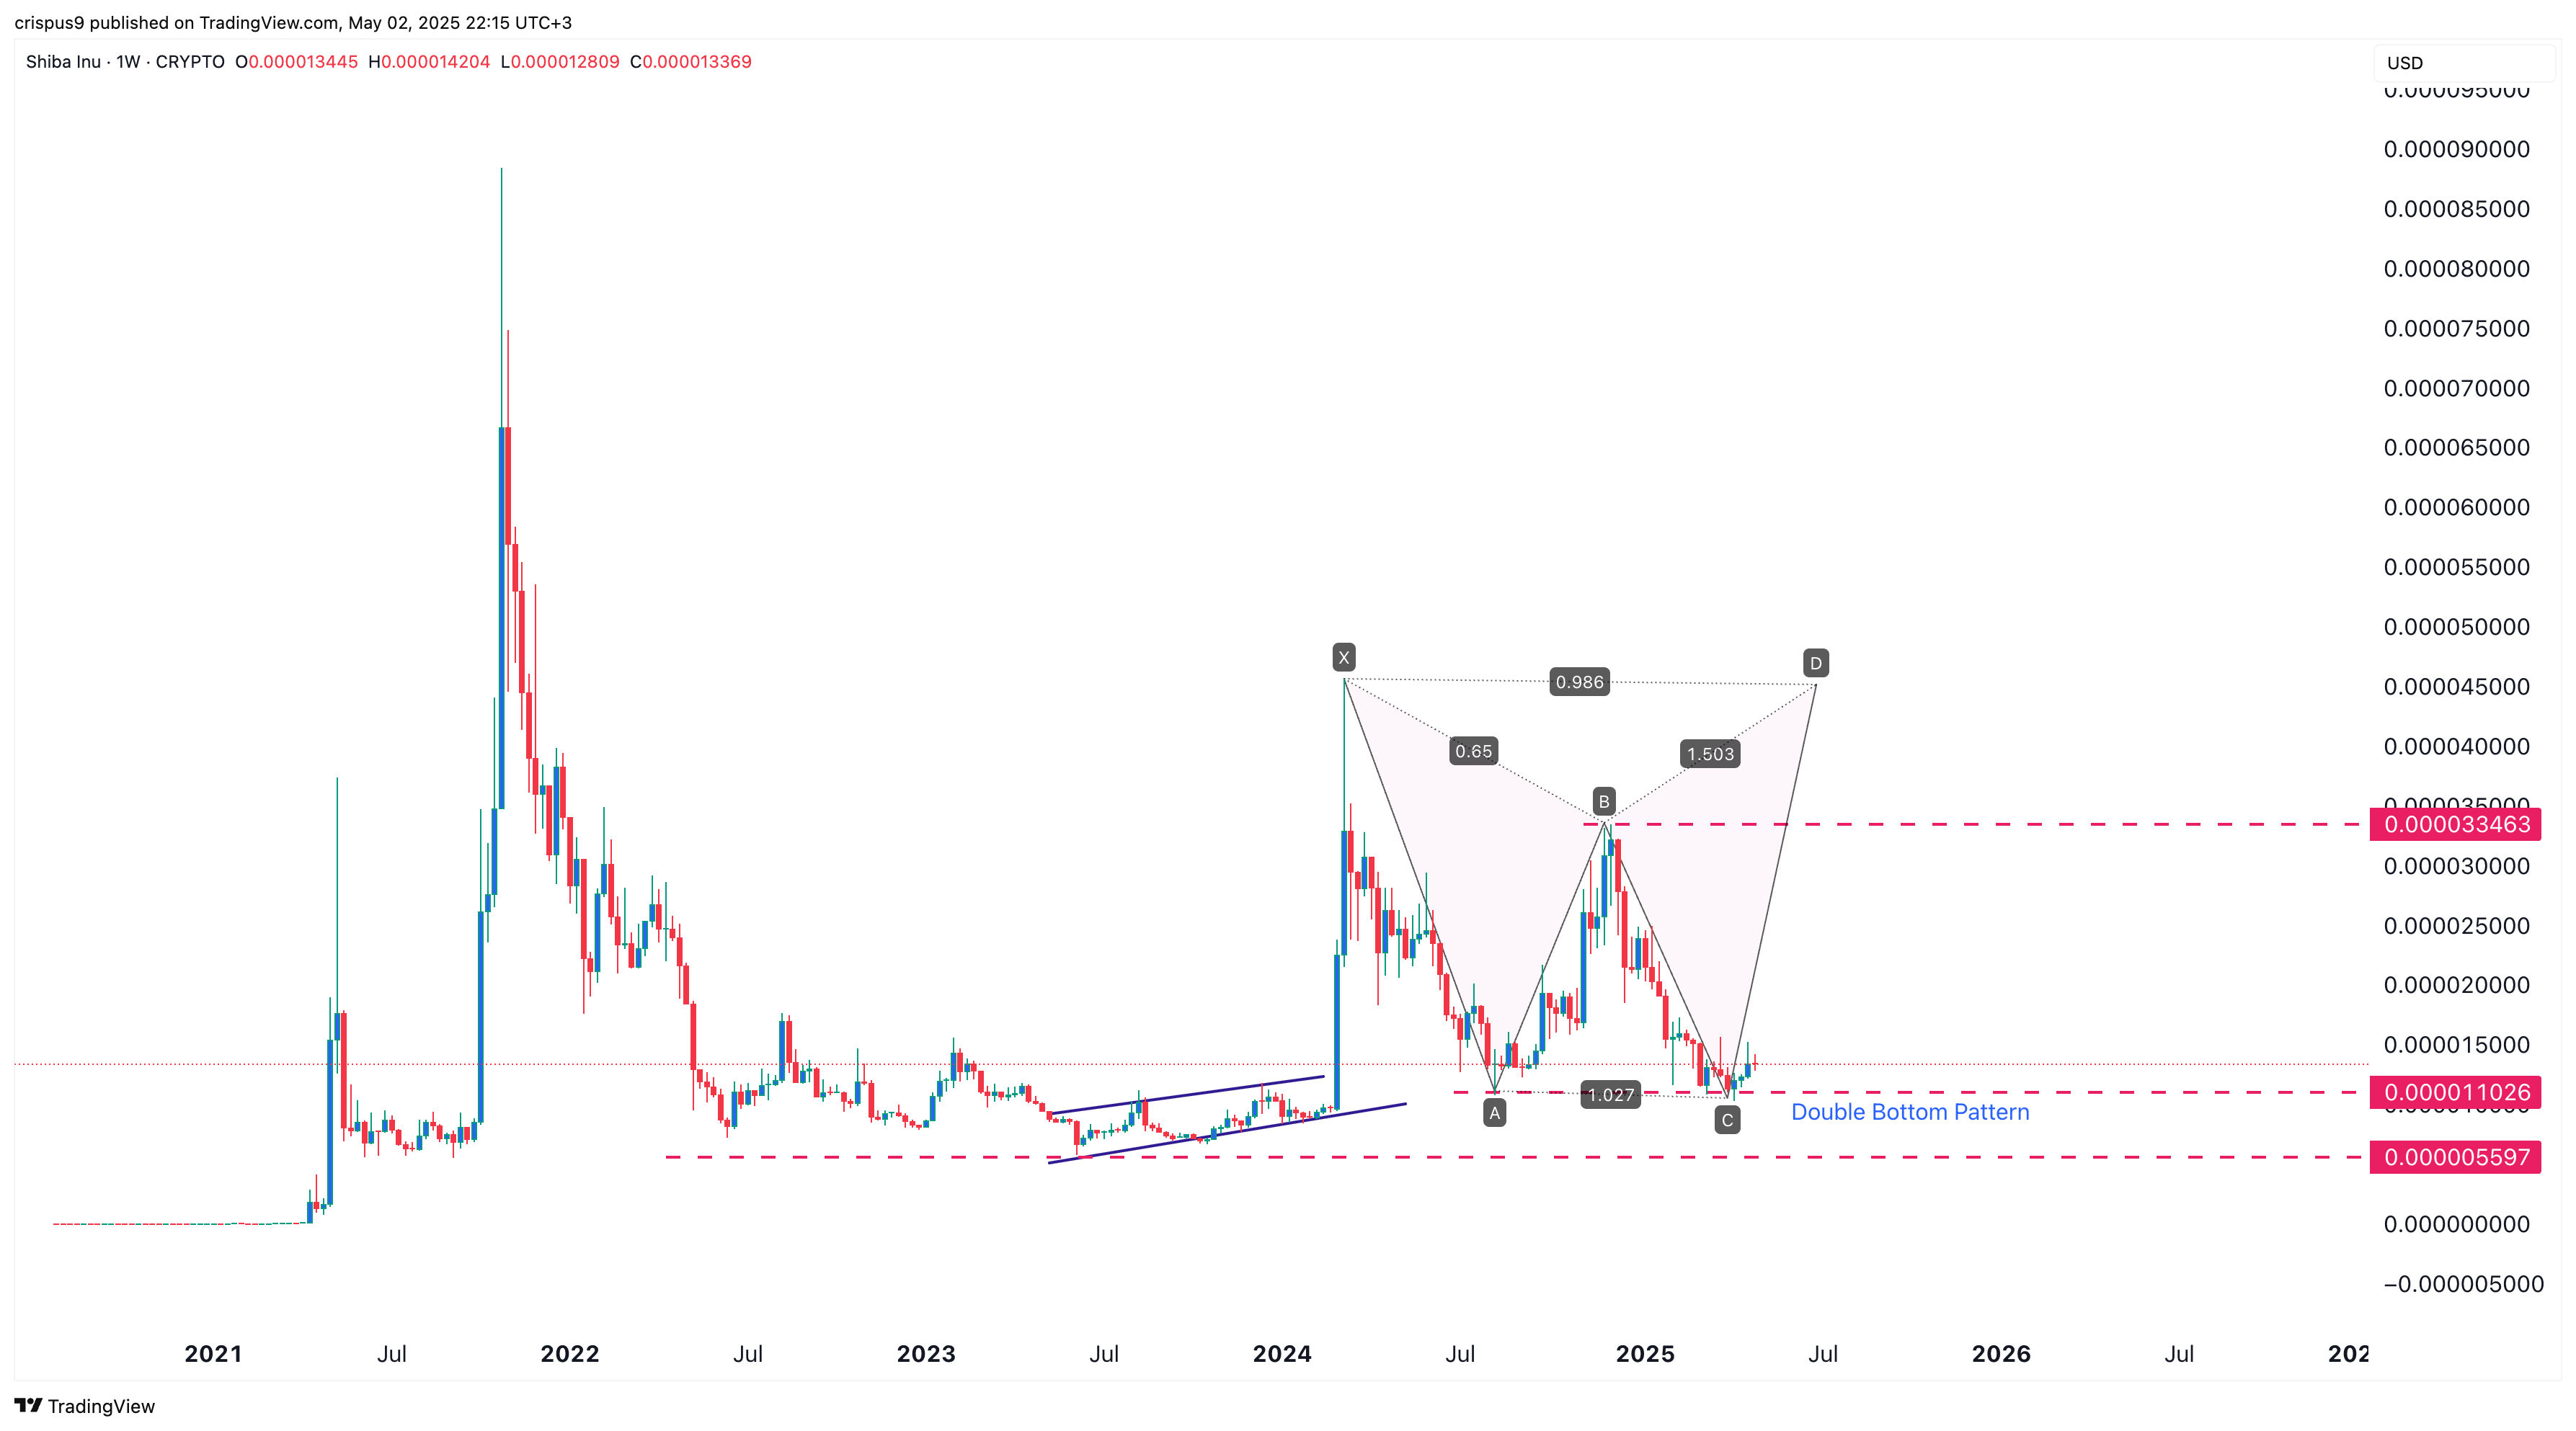
The weekly chart shows that the SHIB price has formed two critical patterns that indicate a surge.
First, it has formed a double-bottom pattern at $0.000011. This pattern has two down-peaks at $0.000011 and a neckline at $0.00003345.
Measuring the distance from the double-bottom to the neckline at $0.000033 shows that the Shiba Inu price will eventually jump to $0.0001042.
Second, SHIB has formed the popular harmonic continuation pattern known as the XABCD. The ‘X’ point was the highest in 2024, and the ‘A’ section was the lowest in August of the previous year.
B was the highest point in November of the previous year, while C was the lowest point this year. The final point of the pattern will be at least the highest level in March of the previous year, which is about 250% above the current level.
Risks to the Bullish SHIB Price Thesis
The bearish Shiba Inu Coin price outlook will become invalid if it drops below the neckline at $0.000011. Such a move will signal more downside, potentially to a low of $0.0000055, its lowest level on June 5, 2023.
The first risk is that Shiba Inu is a meme coin on Ethereum’s network; in some instances, its performance mirrors Ethereum’s. As BanklessTimes has written before, there is a real risk that the Ethereum price will decline to $1,000 because it has formed a triple-top chart pattern on the weekly.
Second, there is a risk that investors will embrace the concept of ‘selling in May and going away’. This is a concept where cryptocurrency often underperforms during the summer months. If this happens, the coin will either remain in a tight range or surge.
Third, the meme coin industry has a growing competition risk as traders rotate to those on the Solana ecosystem. Recent data shows that top Solana meme coins like Fartcoin and Bonk have surged by over 10%.
READ MORE: Trump Backs 1 Million Bitcoin Purchase in Historic New Bill