

The Sui token is currently trading at $3.76 after falling 29.43% from its $5.35 all-time high recorded on January 6, 2025. However, it has seen a slight 1.35% increase over the past 24 hours, with the market now divided on where the SUI price is headed next.
With a market cap of $12.56 billion, the SUI Coin has been one of the most-watched altcoins in 2025. However, technical charts and social signals reveal two sharply different outlooks: one warns of a near-term pullback, while the other hints at a bullish breakout toward new highs.
SUI Coin Faces Short-Term Pressure
According to a tweet from popular analyst Ali, the Sui (SUI) coin could face a short-term downside risk. Using the TD Sequential indicator on the 3-day chart, Ali notes that a sell signal has been triggered. The chart shared shows a completed nine-candle sequence, a common sign of exhaustion in upward momentum.
“$SUI looks ready to pull back,” he writes, suggesting that profit-taking could kick in soon.
The TD Sequential tool has historically been reliable in predicting short- to mid-term reversals, especially after aggressive run-ups. SUI is no stranger to these.
Since its October 2023 low of $0.36, the SUI token has soared over 930%. Even in the last month, SUI has gained more than 77%, making it one of the best-performing tokens this quarter.
However, rapid growth often invites corrections, and Ali’s chart highlights that a cooling-off may be on the horizon.
Inverse Head & Shoulders Pattern Targets $5.60
While some analysts urge caution, others see a golden opportunity. A tweet from crypto-trading signal providers Rose Premium Signals presents a much more optimistic case.
On the daily timeframe, SUI coin appears to be retesting the neckline of a confirmed Inverse Head & Shoulders pattern, a classic bullish reversal setup. If this happens, the chart suggests potential SUI price targets of $4.76 and $5.67.
This aligns with the historical behavior of inverse H&S patterns, which often indicate the end of a downtrend and the beginning of a strong bullish phase.
SUI’s all-time high of $5.35 was reached just four months ago, in January 2025. Breaking past that resistance could fuel another explosive move.
$SUI at a Crossroads: Will the Bulls or Bears Take Over?
Candlestick data from TradingView shows a choppy pattern, with bulls and bears fighting for control in the $3.70–$3.85 range. The last 24 hours alone have seen minor fluctuations between those levels, indicating indecision and low conviction among traders.
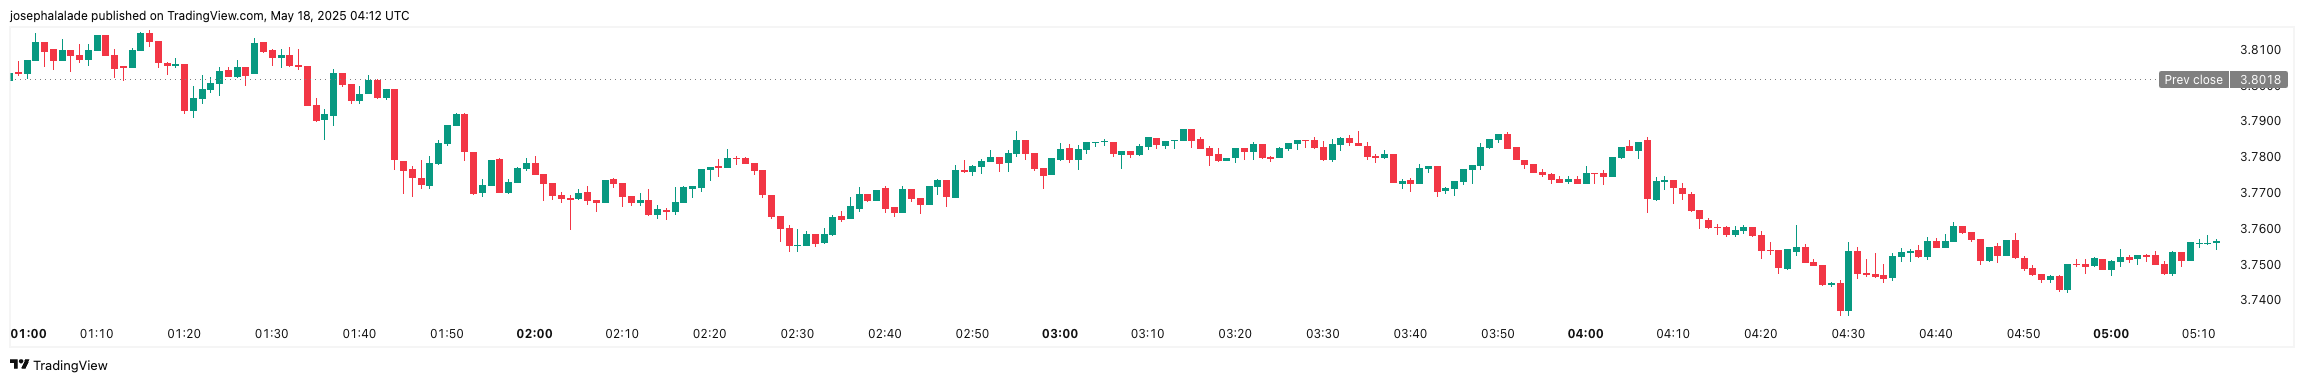
This sideways price action typically precedes either a sharp breakout or a swift breakdown, especially when paired with contrasting chart patterns like the ones currently in play.
Therefore, if the TD Sequential signal plays out, the SUI Coin price could fall back to key support levels near $3.40–$3.50, especially if Bitcoin or broader markets show weakness. In extreme cases, a break below $3.20 could trigger panic selling, dragging it closer to $2.90.
Meanwhile, if the Inverse Head & Shoulders setup confirms, SUI Coin may quickly revisit its previous high of $5.35. A clean break above that could push the price toward the $5.60–$5.70 range.
READ MORE: Bitcoin Price Prediction: Why the Moody’s US Downgrade is Bullish for BTC