


- SharpLink stock price has formed a double-bottom pattern on the daily chart.
- The company is benefiting from the ongoing Ethereum price rebound.
- Ethereum has formed an inverted head-and-shoulders pattern on the weekly chart.
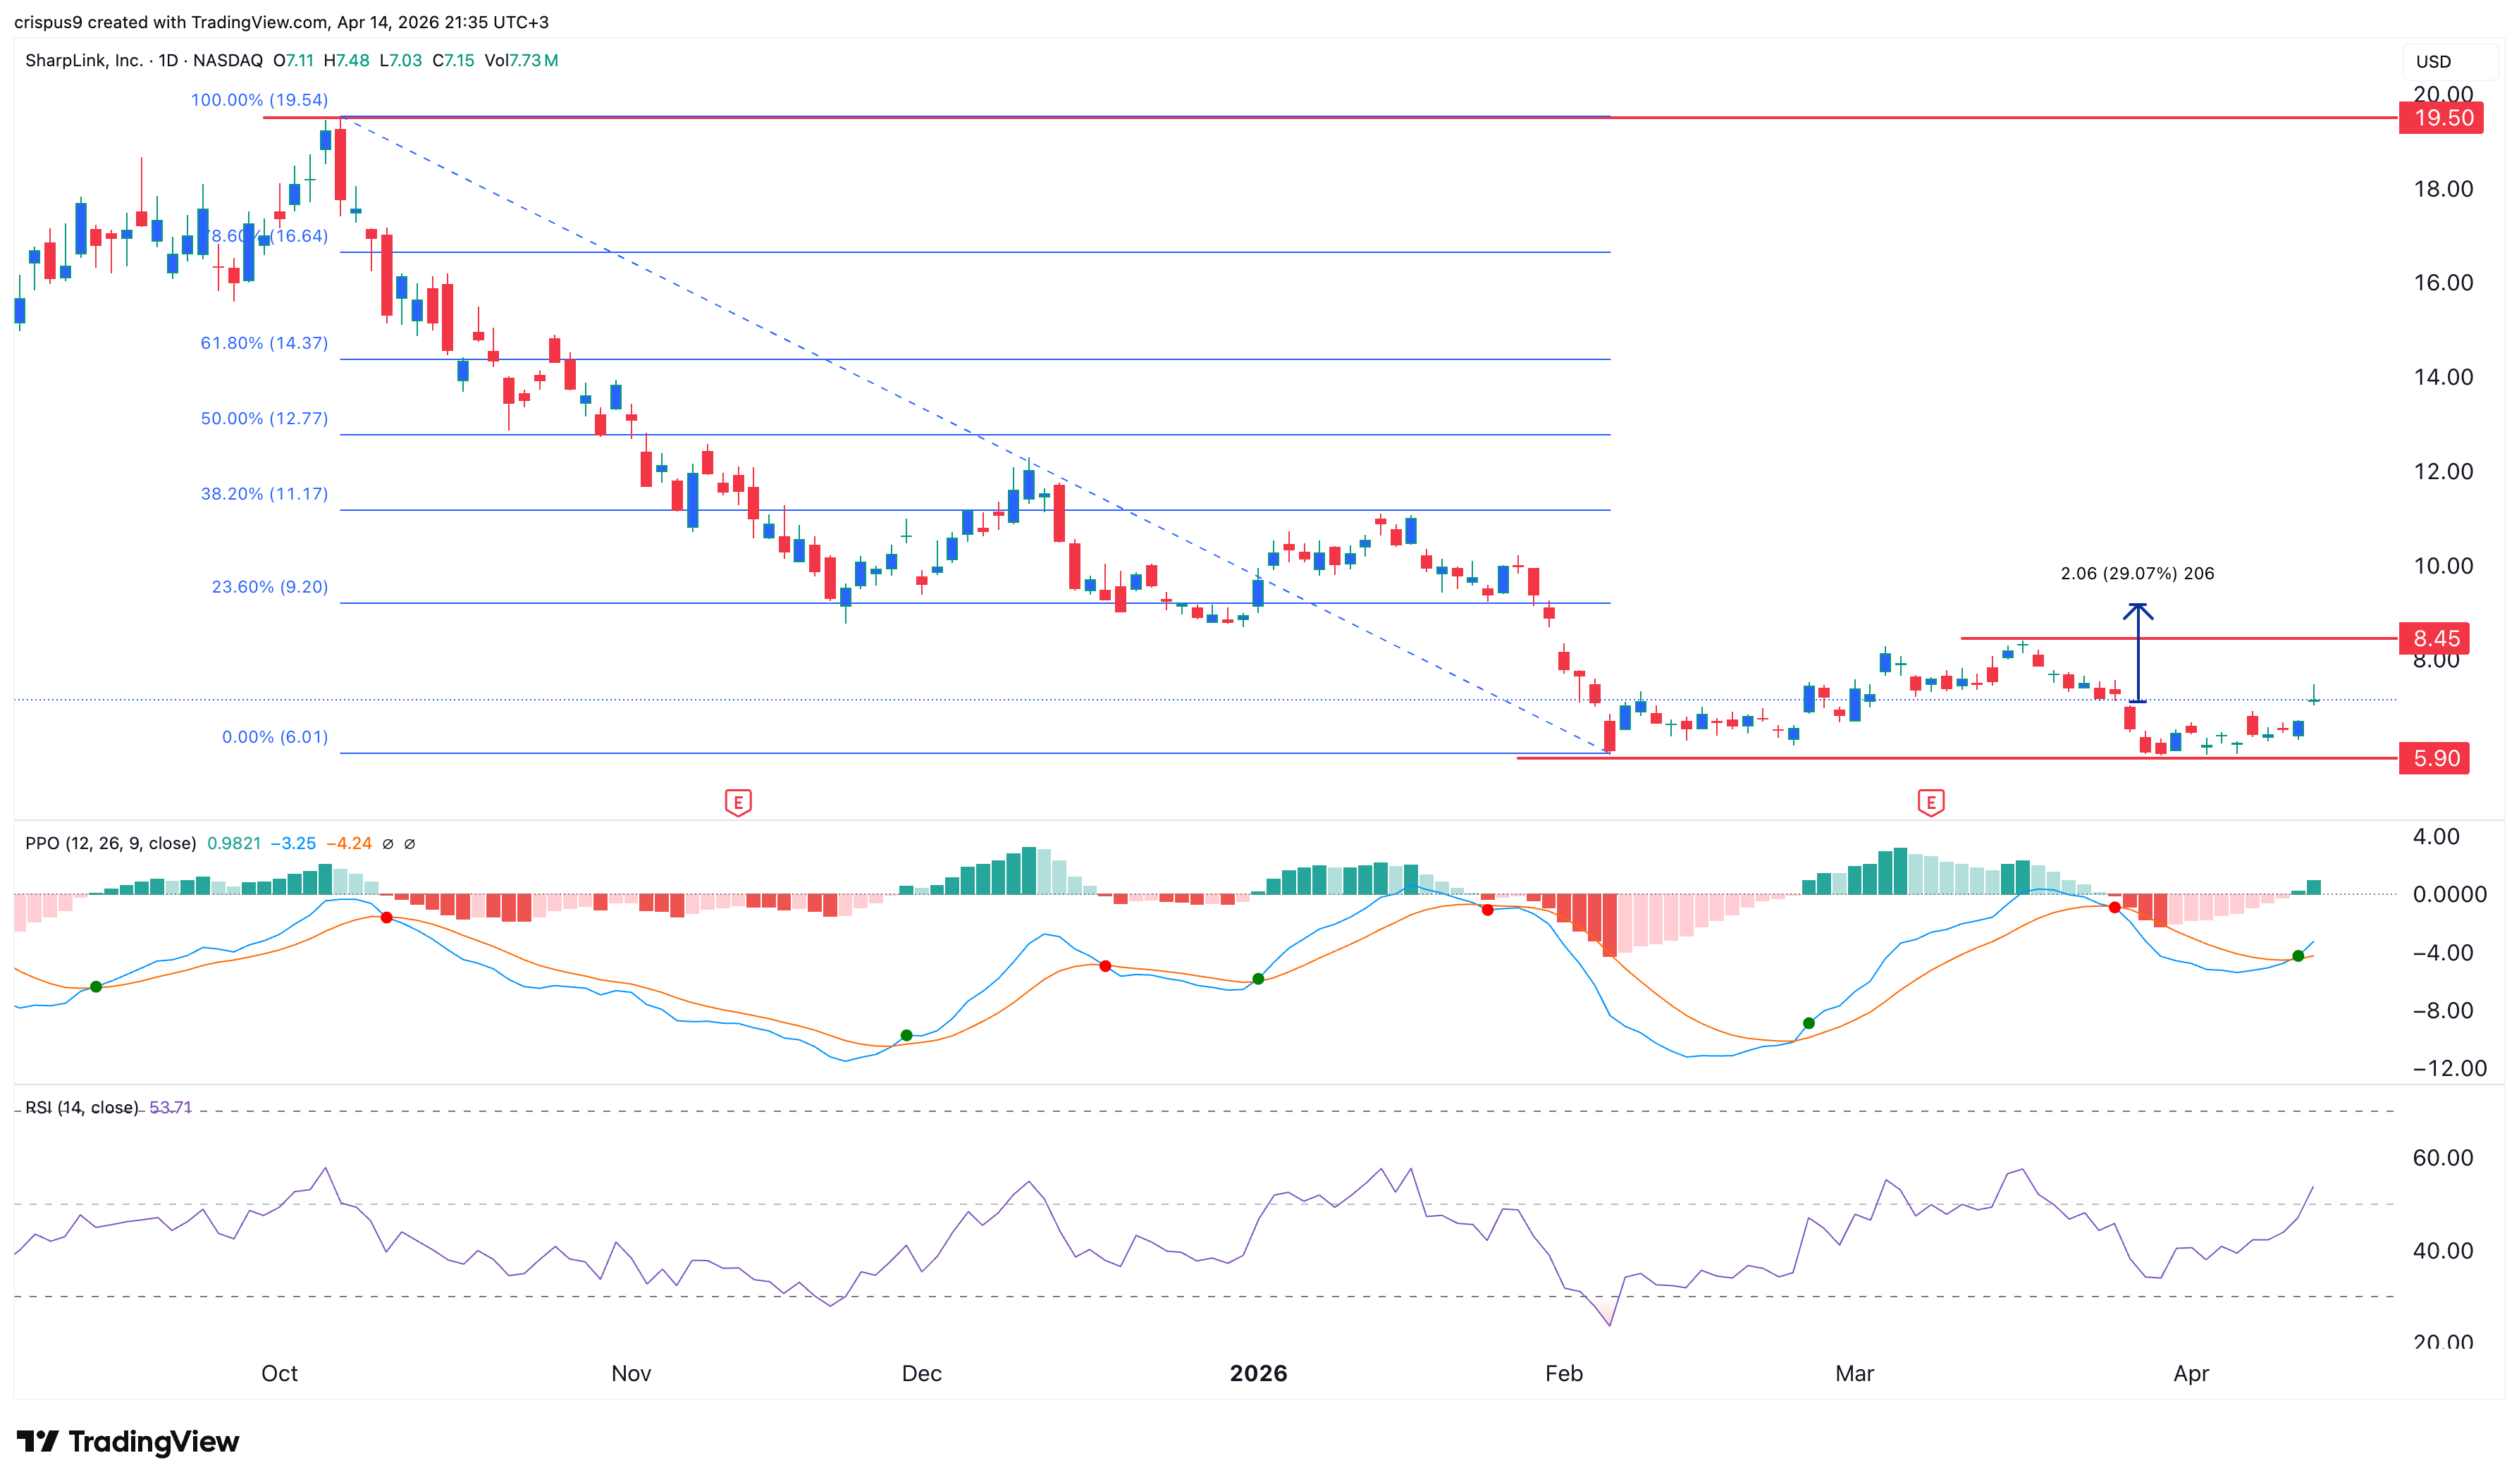
Sharplink stock price jumped by over 6.3% on Tuesday as a risk-on sentiment spread in the market. SBET jumped to $7.13, up modestly from the year-to-date low of $5.90. It has also formed a double-bottom pattern, pointing to an eventual rebound, potentially to the neckline at $8.45 and above.
SharpLink Stock Has Formed a Highly Bullish Pattern
The daily chart shows that the SBET share price has been in a strong freefall in the past few months. This retreat saw it plunge from a high of $19.50 in October last year to a low of $5.90. It coincided with the Ethereum plunge and the overall retreat of Digital Asset Treasury (DAT) companies.
On the positive side, there are signs that this BitMine rival is bottoming, as it has formed a double bottom at $5.90. This pattern is characterized by two lower swings and a neckline. In this case, the lower swings are at $5.90, while the neckline is at $8.45.
READ MORE: Circle Stock Analysis: Elliot Wave Pattern Points to a Jump to $200
Meanwhile, the two lines of the Percentage Price Oscillator (PPO) have made a bullish crossover, while the Relative Strength Index (RSI) has jumped and crossed the neutral point at 50.
Therefore, the stock will likely continue rising in the coming days, potentially to the key resistance level at $8.45. A move above that level will point to more gains, potentially to the 23.6% Fibonacci Retracement level at $9.20, which is about 30% above the current level.
The bullish SharpLink stock outlook will become invalid if it drops below the important support level at $5.90, its lowest level this year.
Ethereum Price Has Formed an Inverted Head-and-Shoulders Pattern
SharpLink is the second-largest Ethereum treasury company, with 871,563 coins on its balance sheet. Its average Ethereum purchase price was $3,609, meaning that the company has suffered an unrealized loss of over $1 billion as the ETH coin has slumped.
Therefore, its recovery will depend on Ether’s performance, and the longer-term chart shows that it may rebound sharply in the coming weeks.
Ethereum has formed some highly bullish patterns on the daily and weekly charts. It has formed a double-bottom pattern at $1,920 and a neckline at $2,390 on the daily chart.
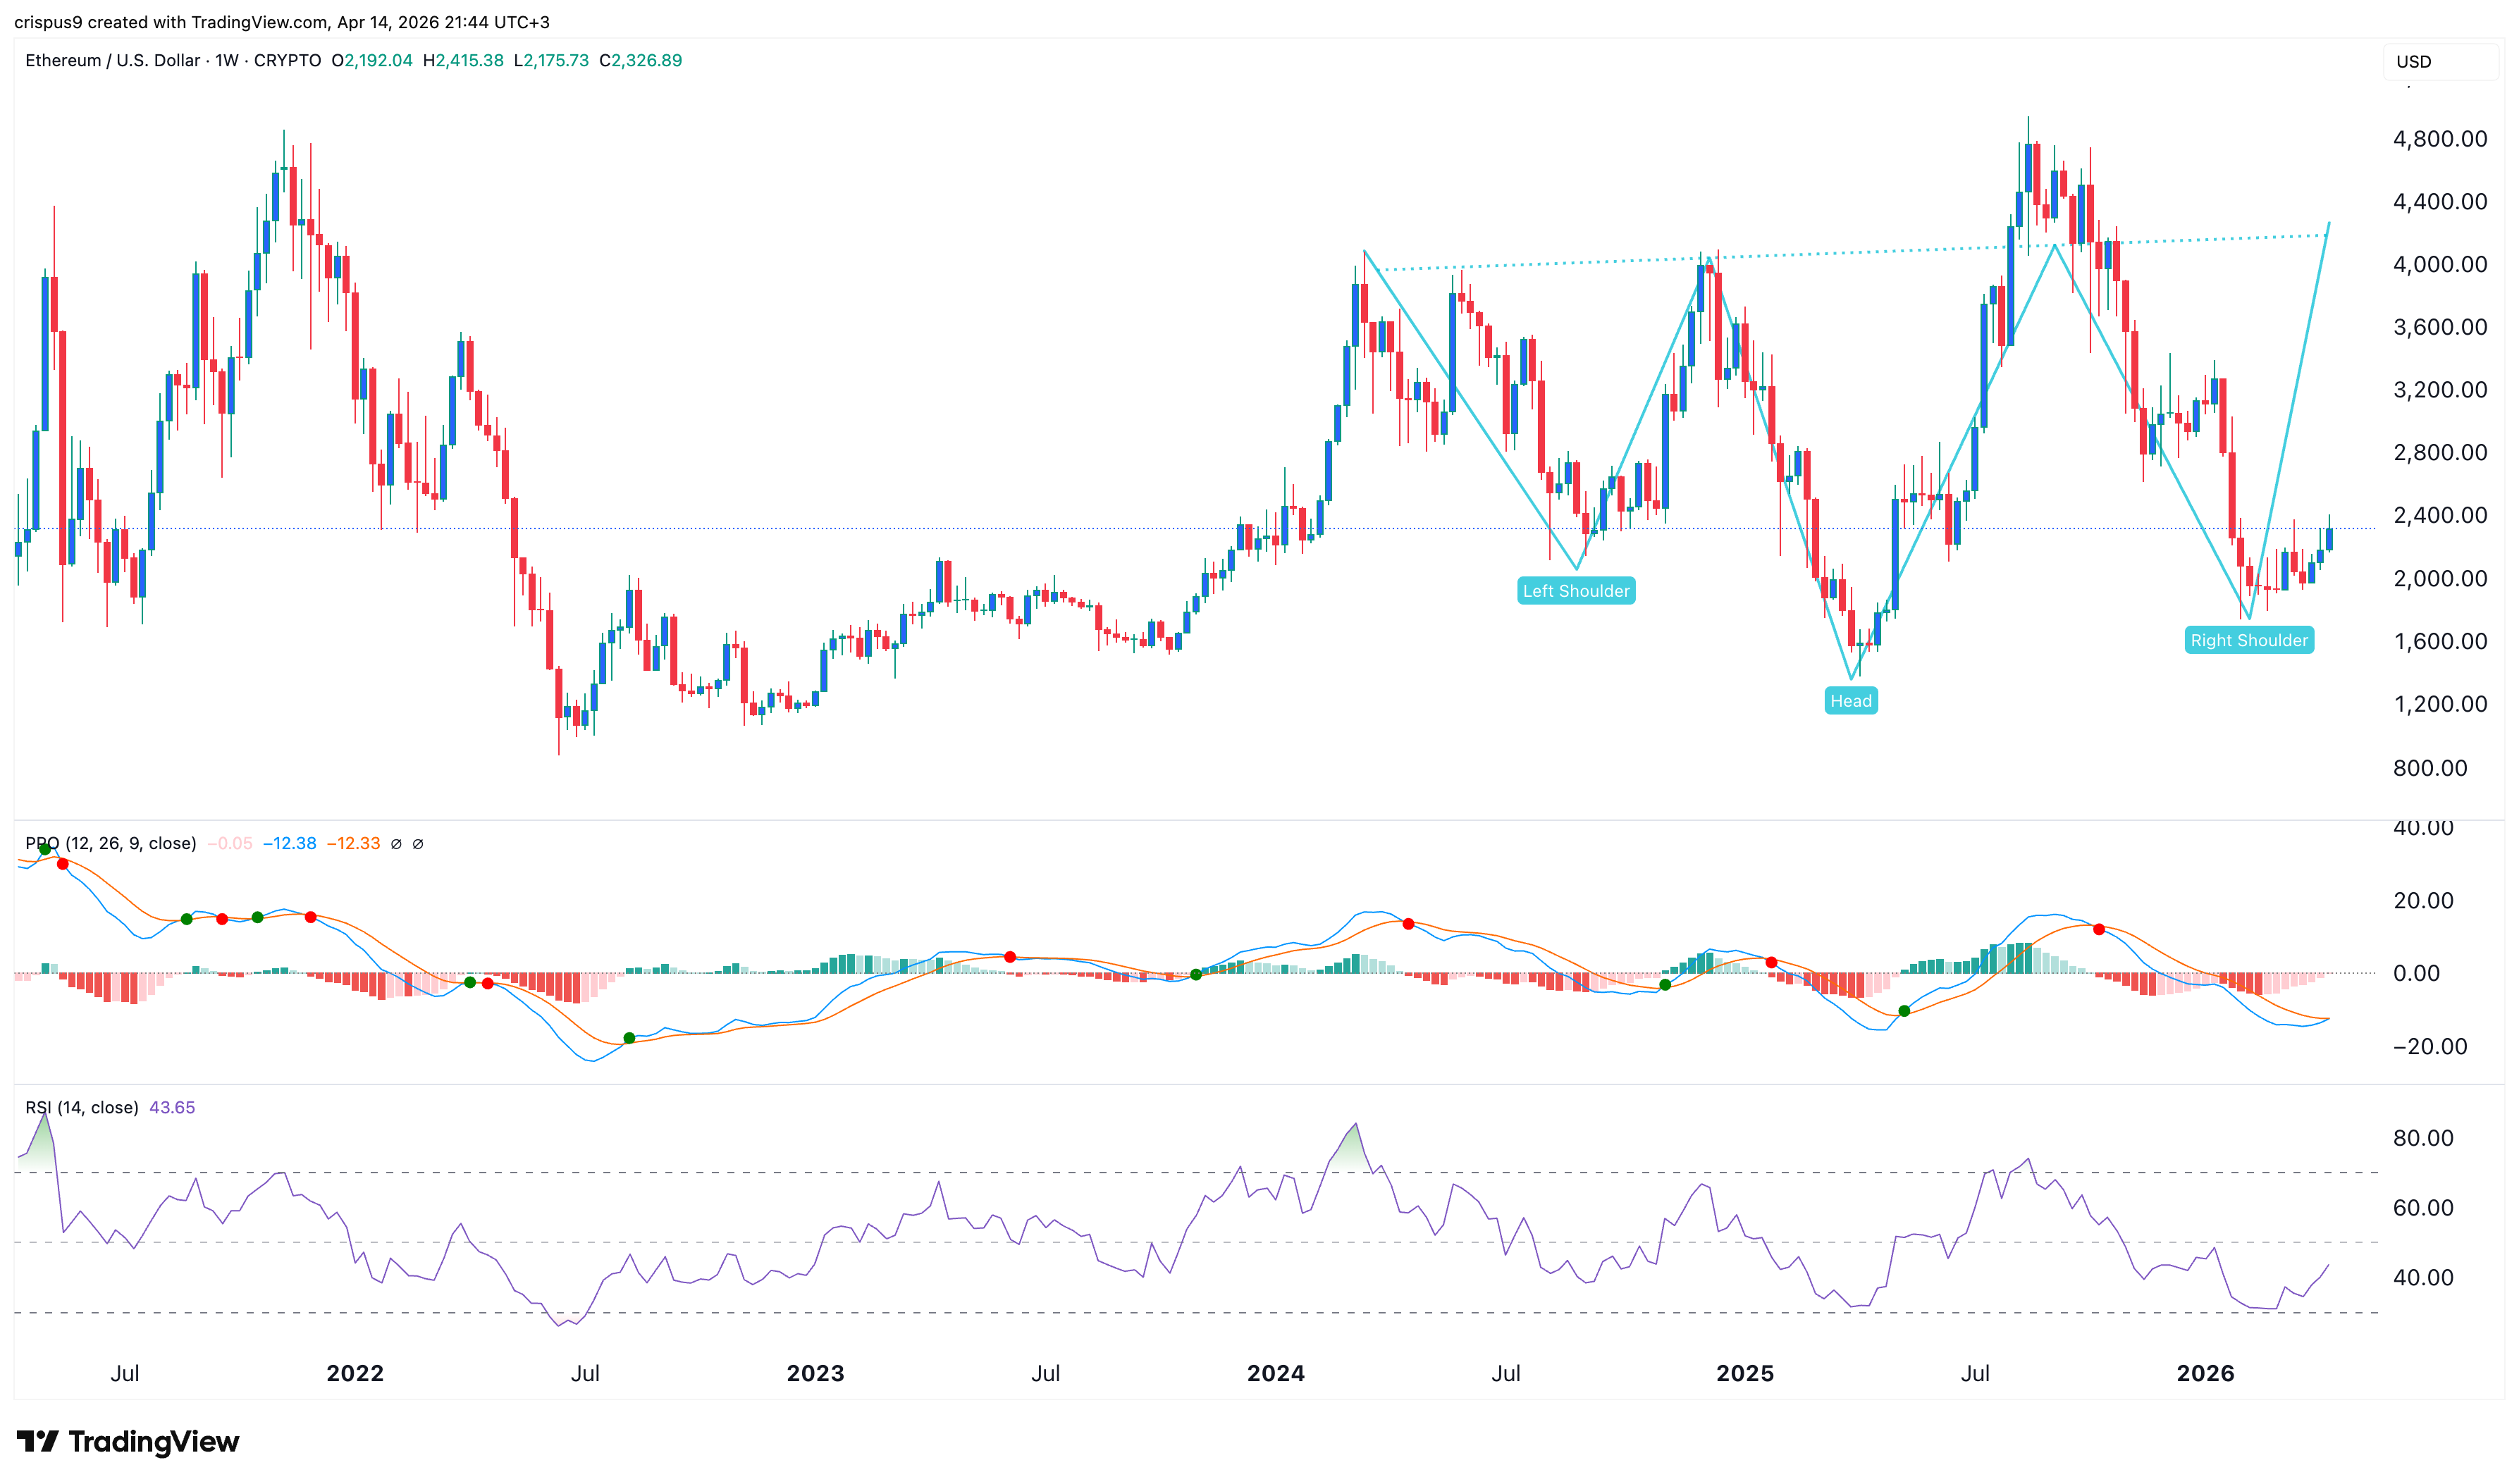
Most importantly, the weekly chart shows that it has formed a large inverted head-and-shoulders pattern, and is now in the right shoulder.
At the same time, as the chart above shows, the two lines of the PPO indicator are about to form a bullish crossover, while the Relative Strength Index (RSI) has jumped from the oversold level of 32 to the current 43.
Therefore, there is a likelihood that the ETH price will rebound, potentially to $3,000 or higher, which will boost the SharpLink and BitMine stock prices.
READ MORE: Venice Token Price: Wyckoff Theory Points to More Gains as VVV Burn Rate Jumps