


- The MSTR stock price has formed a bearish flag pattern on the three-day chart.
- This pattern means that the stock may soon continue falling in the near term.
- If this happens, the stock may drop to below $100.
The MSTR stock price has attempted to recover this week. It jumped to $143, up modestly from the year-to-date low of $103. Still, MicroStrategy stock has formed a major bearish reversal pattern, suggesting more downside in the near term.
MSTR Stock Price Has Formed a Bearish Flag Pattern
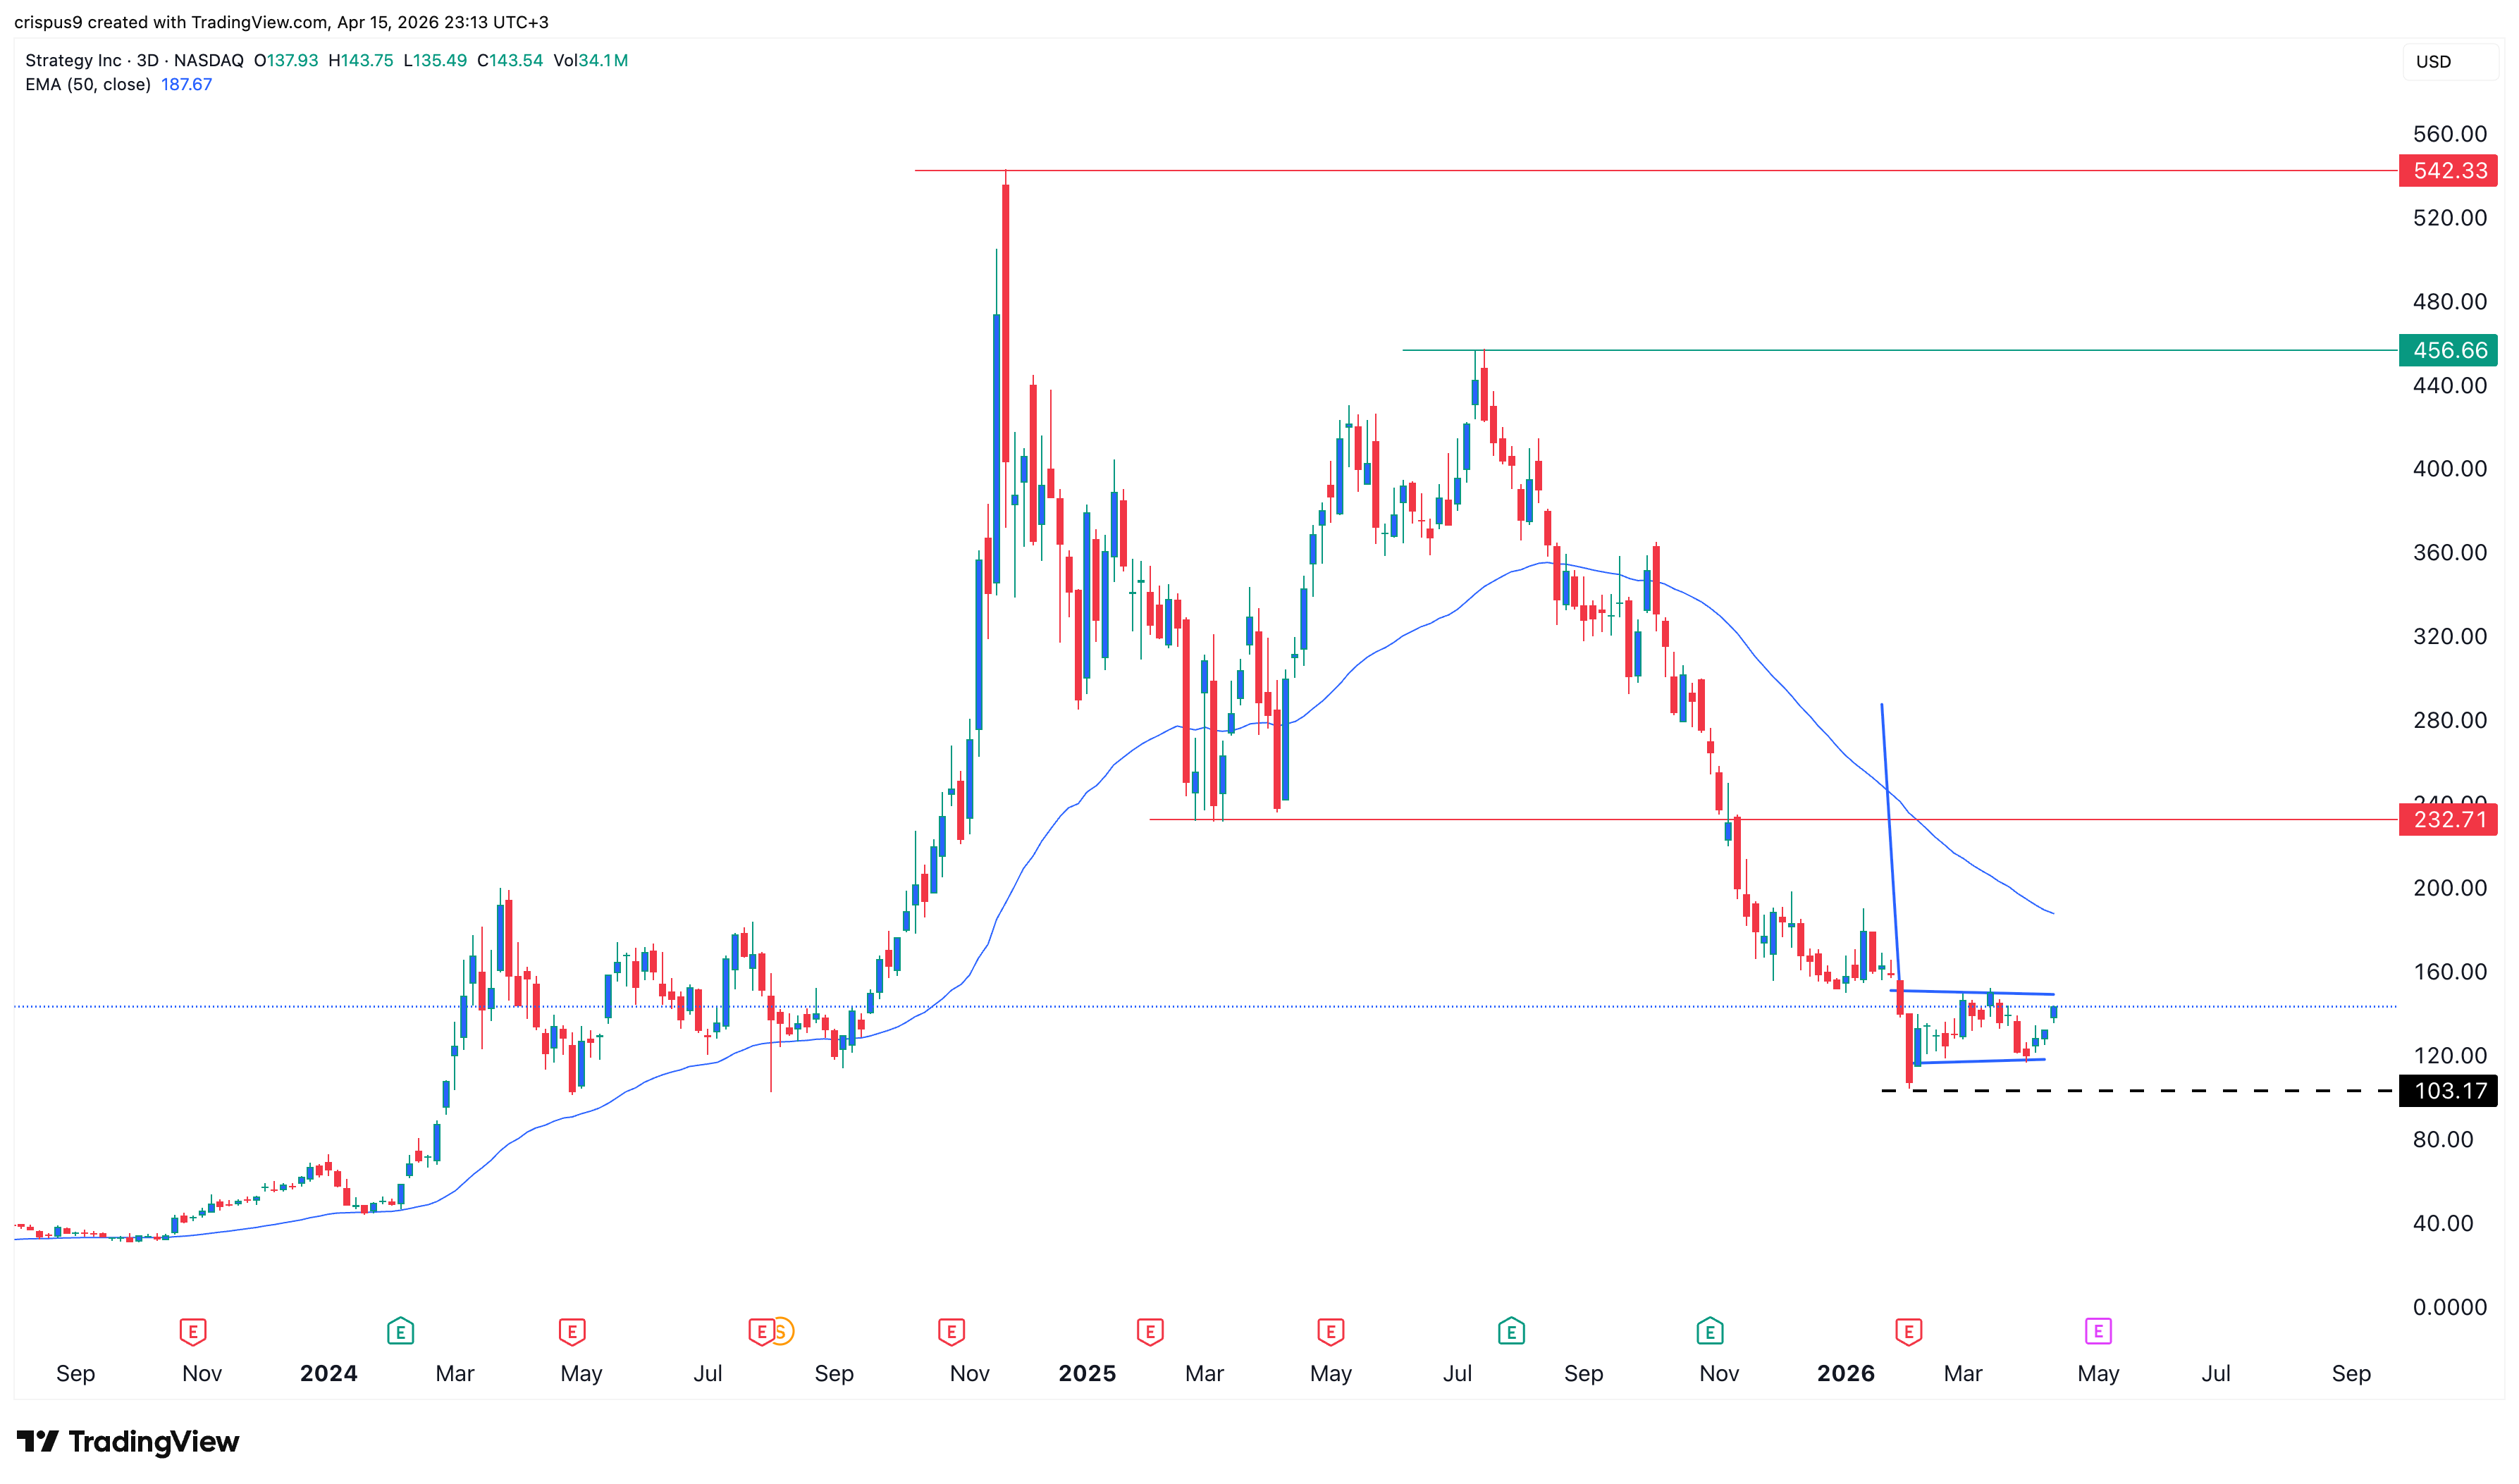
The three-day chart shows that the Strategy stock price peaked at $542 in November 2024 and then retreated to the current $142 level. As the largest corporate BTC holder, this retreat coincided with the overall Bitcoin price weakness and the lack of investor demand for Digital Asset Treasury companies.
The chart shows that the stock has formed a bearish flag pattern, consisting of a long vertical line and a horizontal channel. It retested the upper side of the channel during its recent climb.
The stock has remained below all moving averages, a sign that bears remain in control. It has also dropped below the Supertrend indicator, a sign that bears are in control.
READ MORE: Venice Token Price: Wyckoff Theory Points to More Gains as VVV Burn Rate Jumps
Therefore, the most likely MSTR stock forecast is bearish, with the initial target being the year-to-date low of $103. A drop below that price will signal more downside, potentially to the psychological level at $100.
The bearish outlook will be invalidated if MSTR stock rises above the 50-day Exponential Moving Average at $187. A move above that level will signal further gains toward the psychological level at $200.
This view corresponds with a recent BanklessTimes forecast that found that Bitcoin may also be on the cusp of a strong bearish breakdown after forming a bearish flag pattern on the daily chart.
Strategy Has Continued Its Aggressive Bitcoin Accumulation
The MSTR stock has come under pressure amid Bitcoin’s slump to its lowest level in months. Despite rising by over 20% from its lowest level this year, Bitcoin remains well below where it was a few months ago.
Bitcoin’s performance means that Strategy’s accumulation has been counterproductive. For example, a recent report showed that the company suffered an unrealized $14.5 billion loss in the first quarter of this year.
The company has continued its Bitcoin buying spree, with Michael Saylor and the team predicting that it will eventually rebound to a new all-time high. It raised $1 billion last week and bought 13.9 Bitcoin at an average price of $71.9k. It now holds 780.9k coins bought at an overall average cost of $75.6k.
By holding Bitcoin, Strategy’s business has a major drawback compared with Ethereum treasury companies like SharpLink and Bitwise. Bitcoin only generates a return when its price rises.
In contrast, Ethereum yields about 3% annually through staking. This yield means that they are still making some money during the crypto bear market.
READ MORE: Circle Stock Analysis: Elliot Wave Pattern Points to a Jump to $200