


The stock market has pulled back in the past few days, with the S&P 500 Index hitting its lowest level since May 5 this year. It has dropped by 4.63% from its highest point this year. Similarly, the Dow Jones and Nasdaq-100 indices have slumped sharply from their year-to-date highs. Here are the top risks facing the stock market in 2026.
S&P 500 Index Facing the US-Iran Risk
The S&P 500 Index is facing the risk of the US-Iran conflict. In a statement on Thursday, President Donald Trump said that the US will continue its attack against Iran in the coming weeks. He also warned that he would take Kharg Island and other Iranian oil infrastructure.
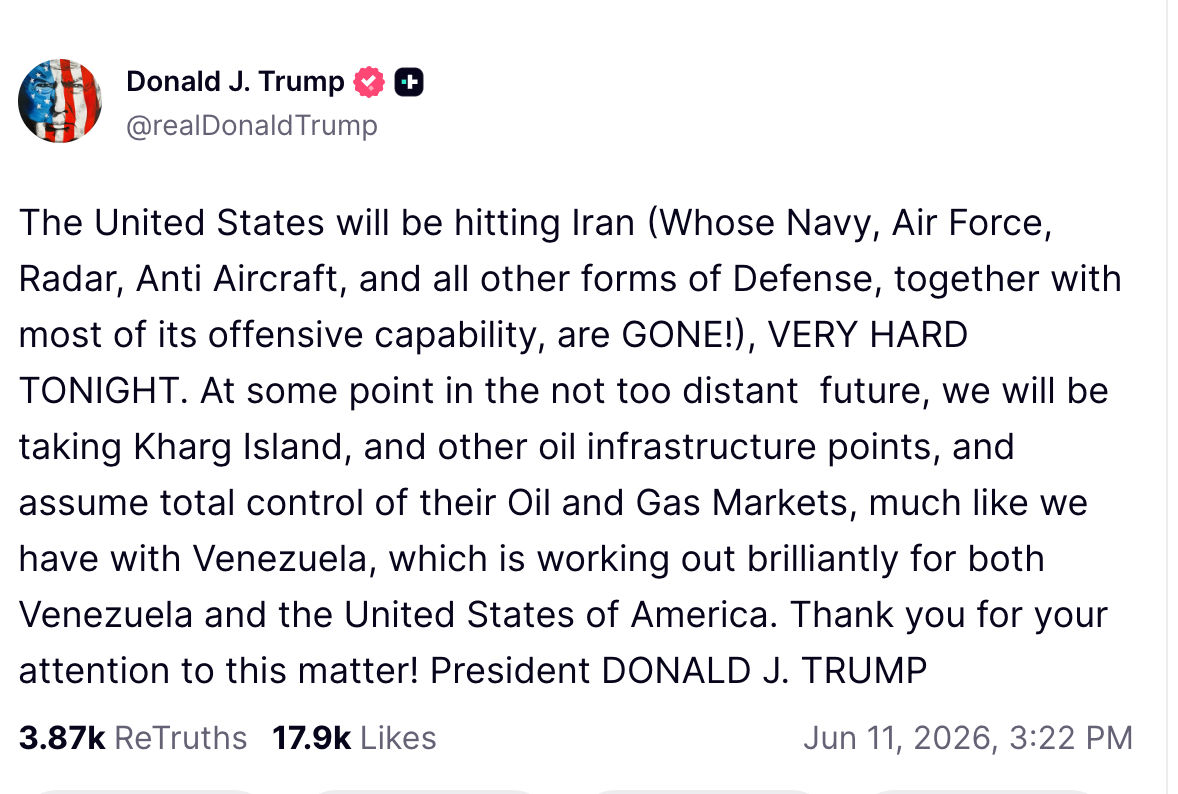
Such a move would lead to higher crude oil prices as Iran would respond by hitting regional infrastructure. Iran has also warned that it will close the Red Sea, through which 12% of all crude oil passes. Higher crude prices would worsen US inflation and push the Federal Reserve to raise interest rates.
READ MORE: Here’s Why Silver, Gold, and Bitcoin Prices Are Lagging the Stock Market
Data released this week showed that the headline Consumer Price Index (CPI) rose to 4.2% in May, while the Producer Price Index (PPI) jumped to 6.4%. These numbers have moved further away from the Fed’s target of 2.0%. This explains why US bond yields have jumped in the past few months.
SpaceX IPO Could Pose a Risk to the US Stock Market
The other main risk facing the S&P 500 Index and its ETFs, like VOO and SPY, is the upcoming SpaceX IPO. Analysts believe that the SPCX stock will jump sharply after the IPO happens and then pull back as early investors book profits.
Therefore, there is a likelihood that the stock market will drop sharply if the SpaceX stock suffers a big reversal.
S&P 500 Index Technical Analysis
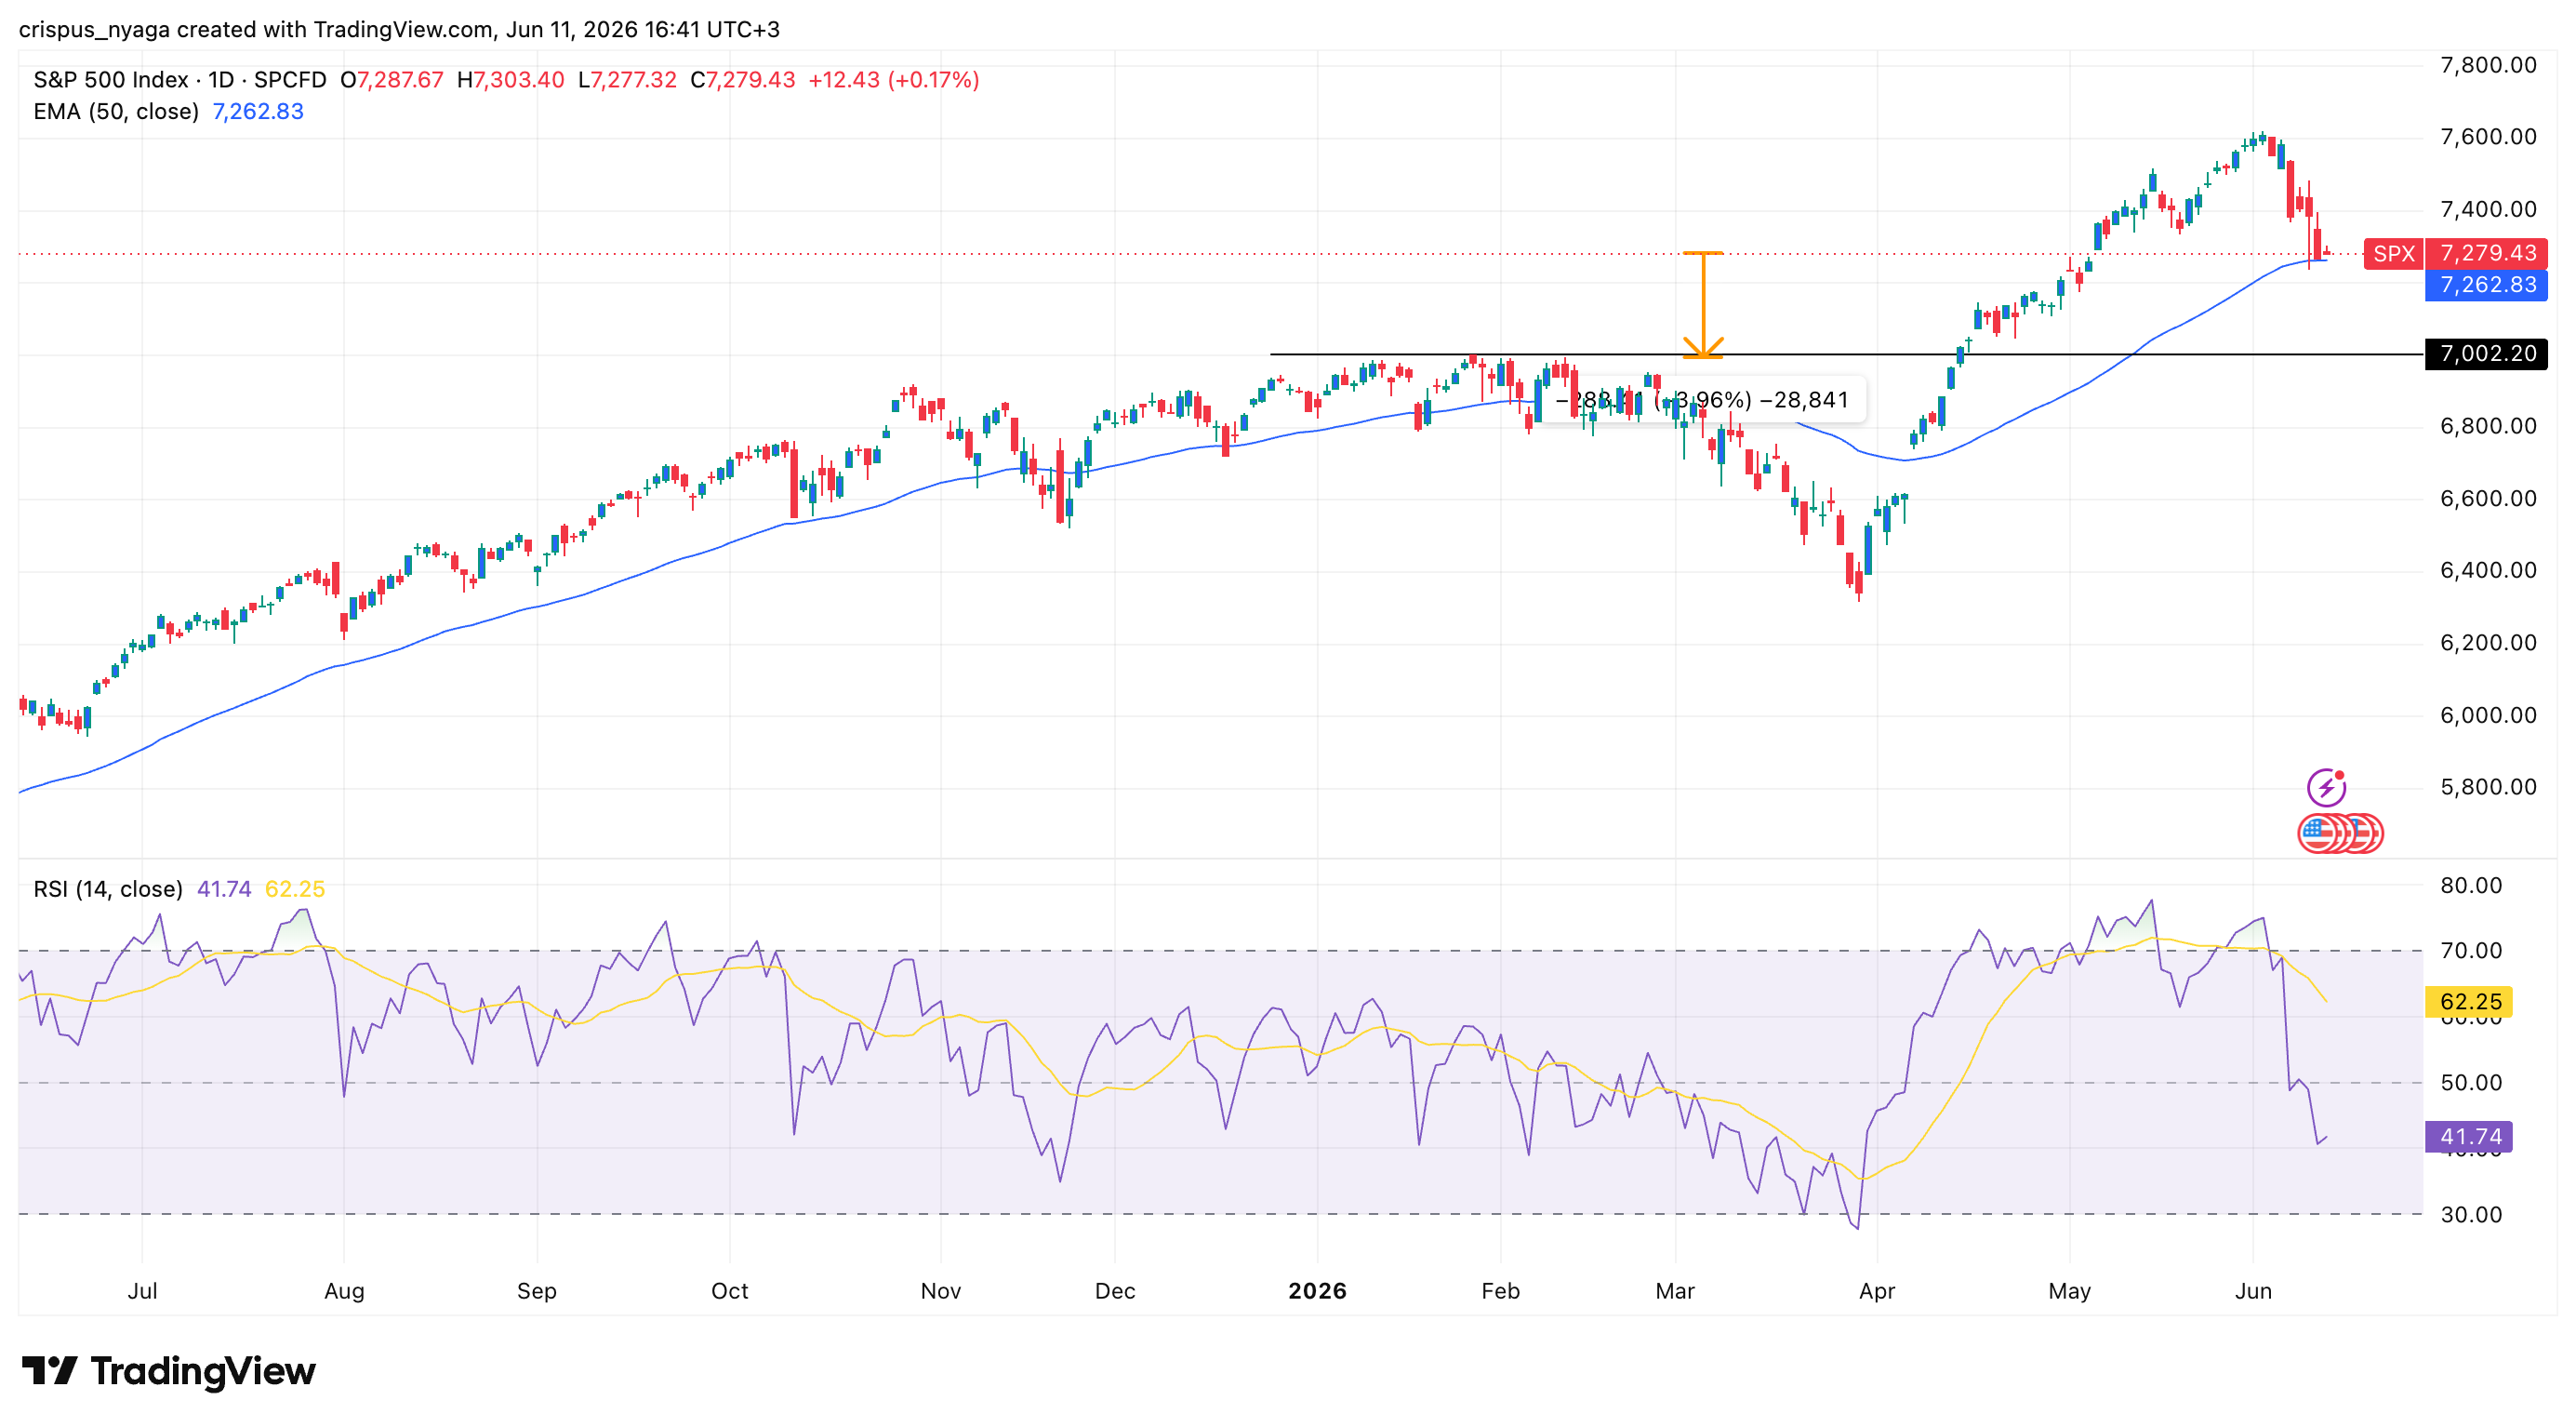
The daily chart shows that the SPX Index has pulled back in the past few days. It is attempting to move below the 50-day moving average.
Also, the Relative Strength Index (RSI) has dropped from the overbought level of 75 to the current 42. The two lines of the Percentage Price Oscillator (PPO) have crossed, which is also a risky sign.
Therefore, the most likely scenario is where the index slips to the important support level at $7,000, its highest point in January this year. This target is about 4% below the current level. Such a retreat will be a break-and-retest pattern, a common bullish continuation sign.
READ MORE: XRP Price Prediction: Here’s Why Ripple Token Has Plunged and What’s Next