


With inflation fears re-emerging since the US Jobs Report announcement, the crypto industry is showing some interesting price movements.
Let us proceed with a comprehensive price analysis of Bitcoin, Ripple, and Binance Coin.
Bitcoin Price Analysis
Bitcoin dipped to $91,756 from its 2025 high of $102,400. On the daily timeframe, a head-and-shoulder pattern has formed, with the neckline around $91,650. While bulls probably see the 90,000 area as a buying opportunity, they must do more to avoid a break below the neckline.
The next test for bulls will be the moving average. If the price drops sharply below the MA, it will likely break below the $91,650 support.
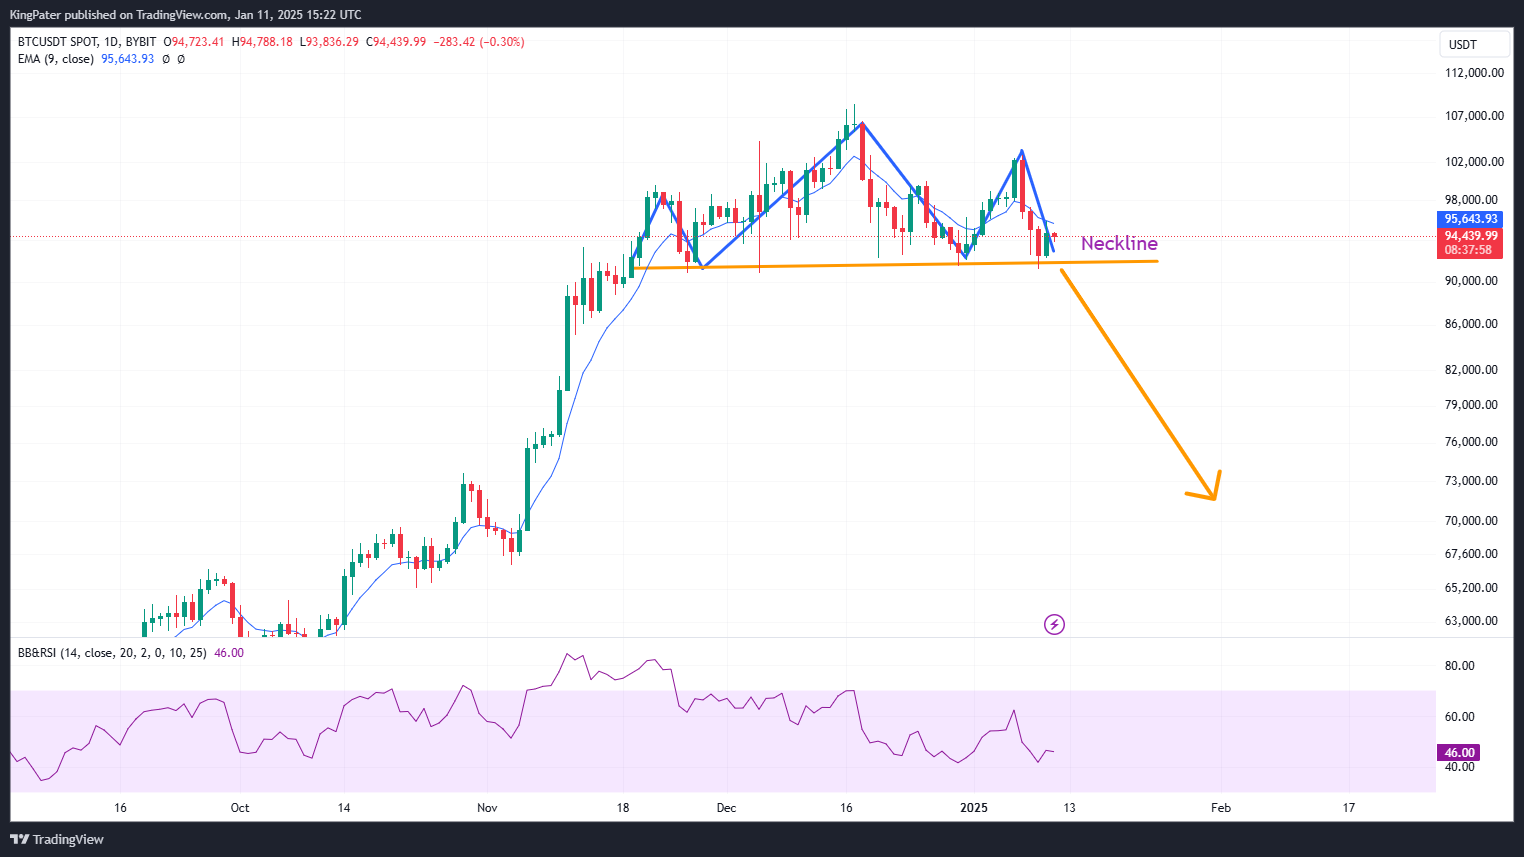
BTC/USDT Daily Chart – Source: TradingView.
On the 2-hour timeframe, we can see a descending triangle pattern. Breaking through the $100,000 resistance zone will be the bull’s short-term target in order to see a trend continuation.
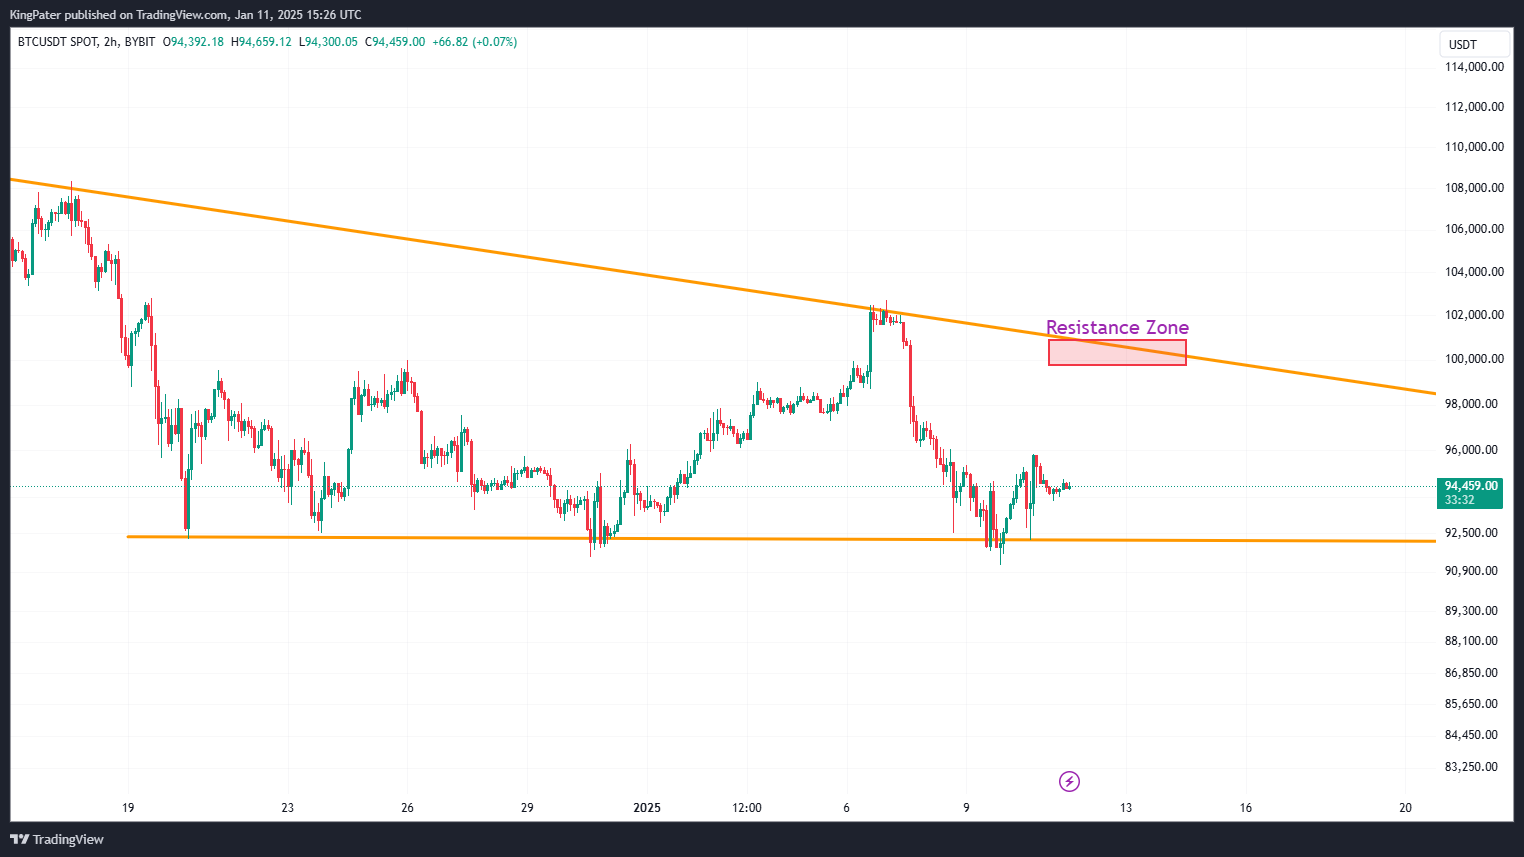
BTC/USDT 2 Hour chart. Source: TradingView.
Ripple (XRP) Price Analysis
XRP’s daily chart shows price is currently ranging within a channel. A couple of lower highs and higher lows cumulate into a balance between buyers and sellers.
If the price breaks above the resistance line, Bulls might extend the rally past $2.7 and 2.9. However, a break below the $1.9 support line might see XRP crash to $1.41, the 61% fib zone.
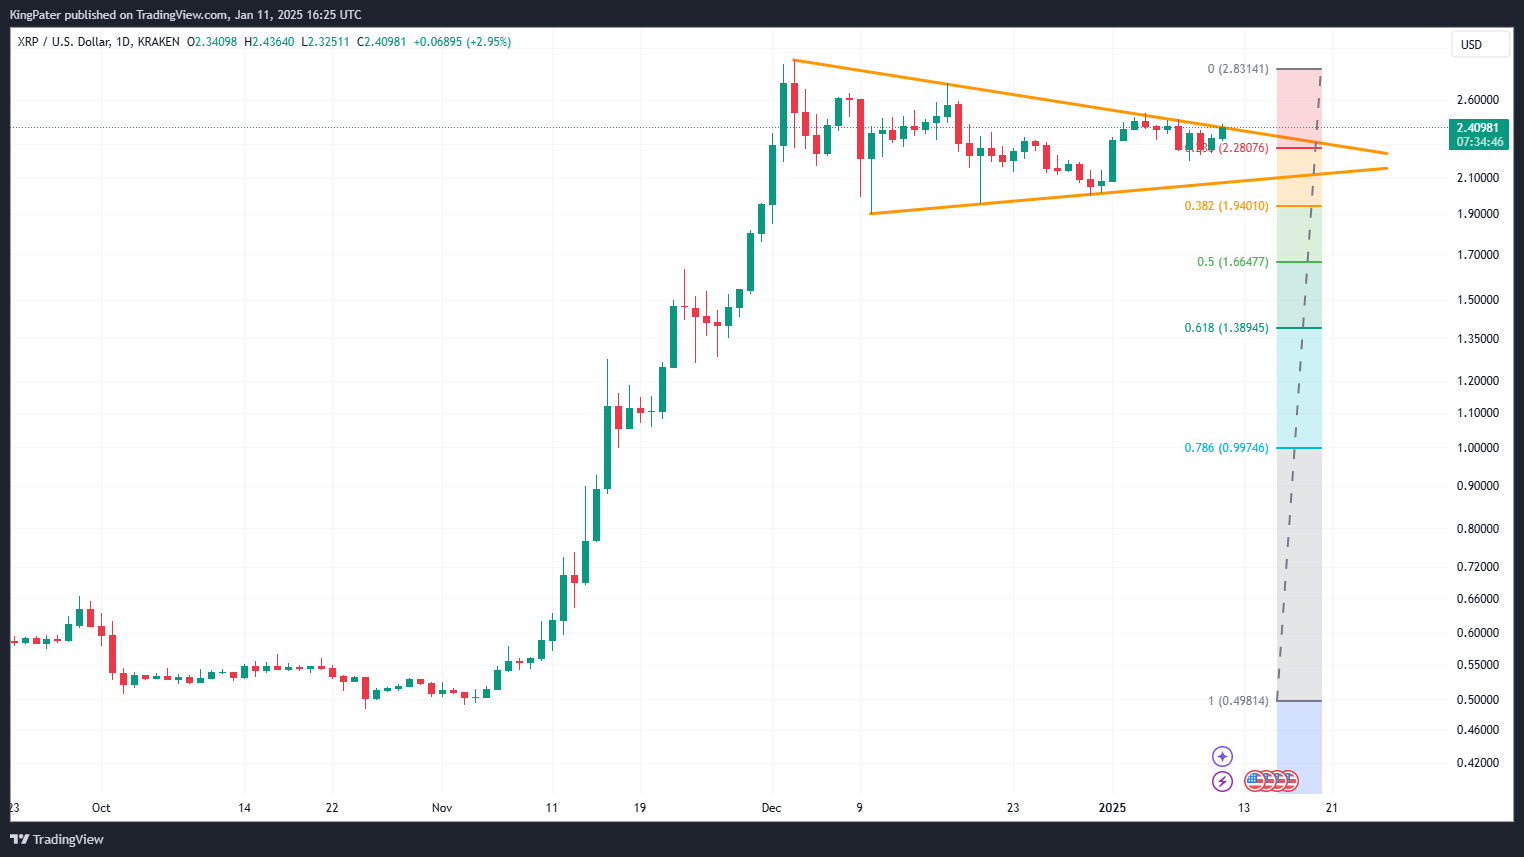
XRP/USDT daily chart. Source: TradingView.
With the XRP price at the resistance line, bears must act quickly to exert a trend change.
Binance Coin (BNB) Price Analysis
BNB’s price has shown a series of higher and lower highs. While the trend shows support at $641, the bears have little firepower.
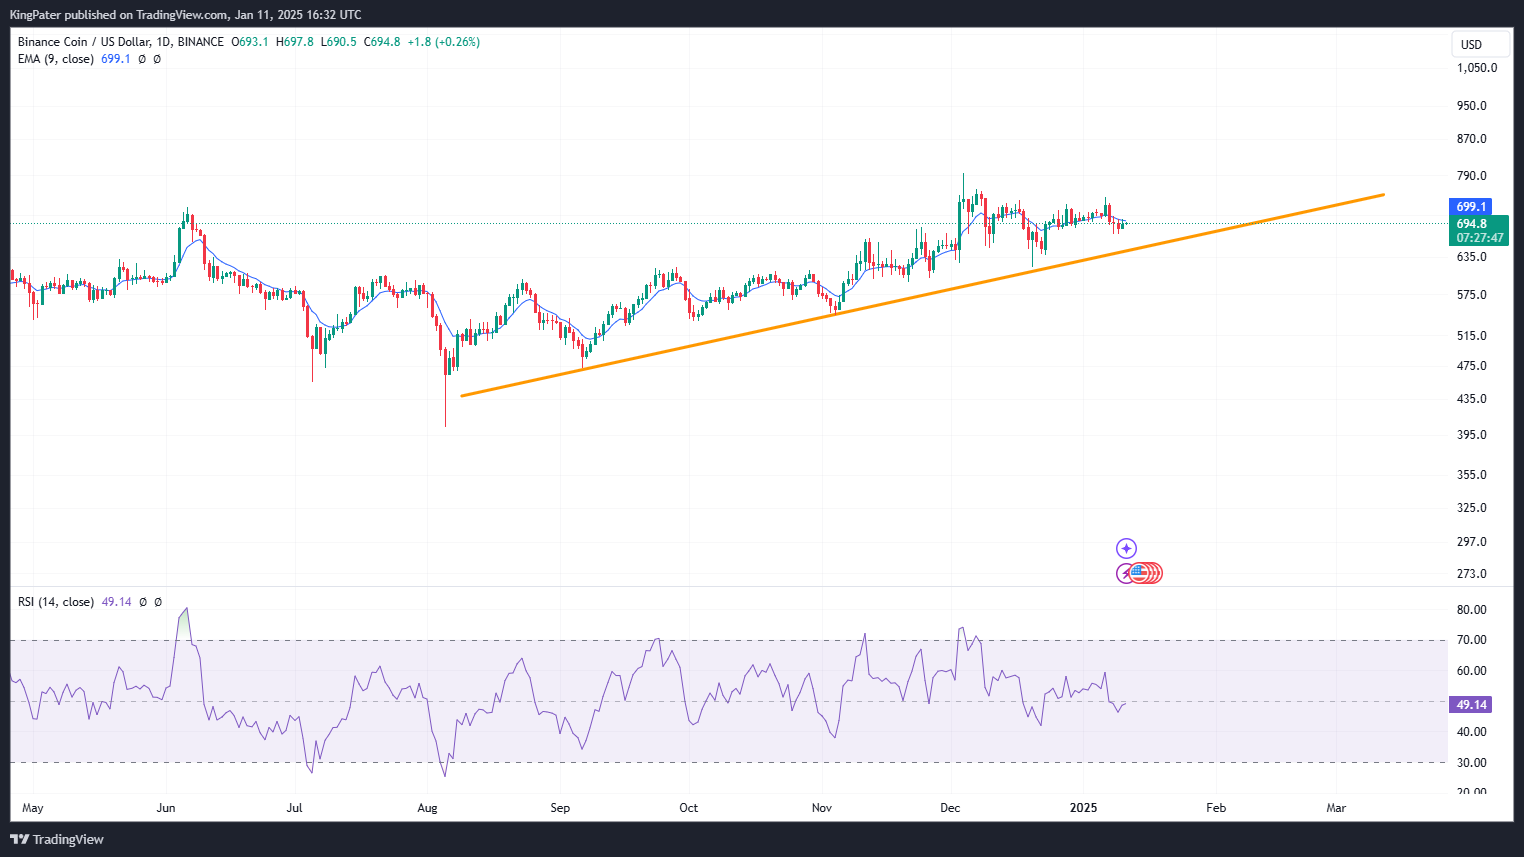
BNB/USDT daily chart. Source: TradingView
On the short timeframe, BNB has formed short-term support at $683, and bulls look poised to defend this support. If this support holds, BNB bulls might push to retest its December highs of $790.
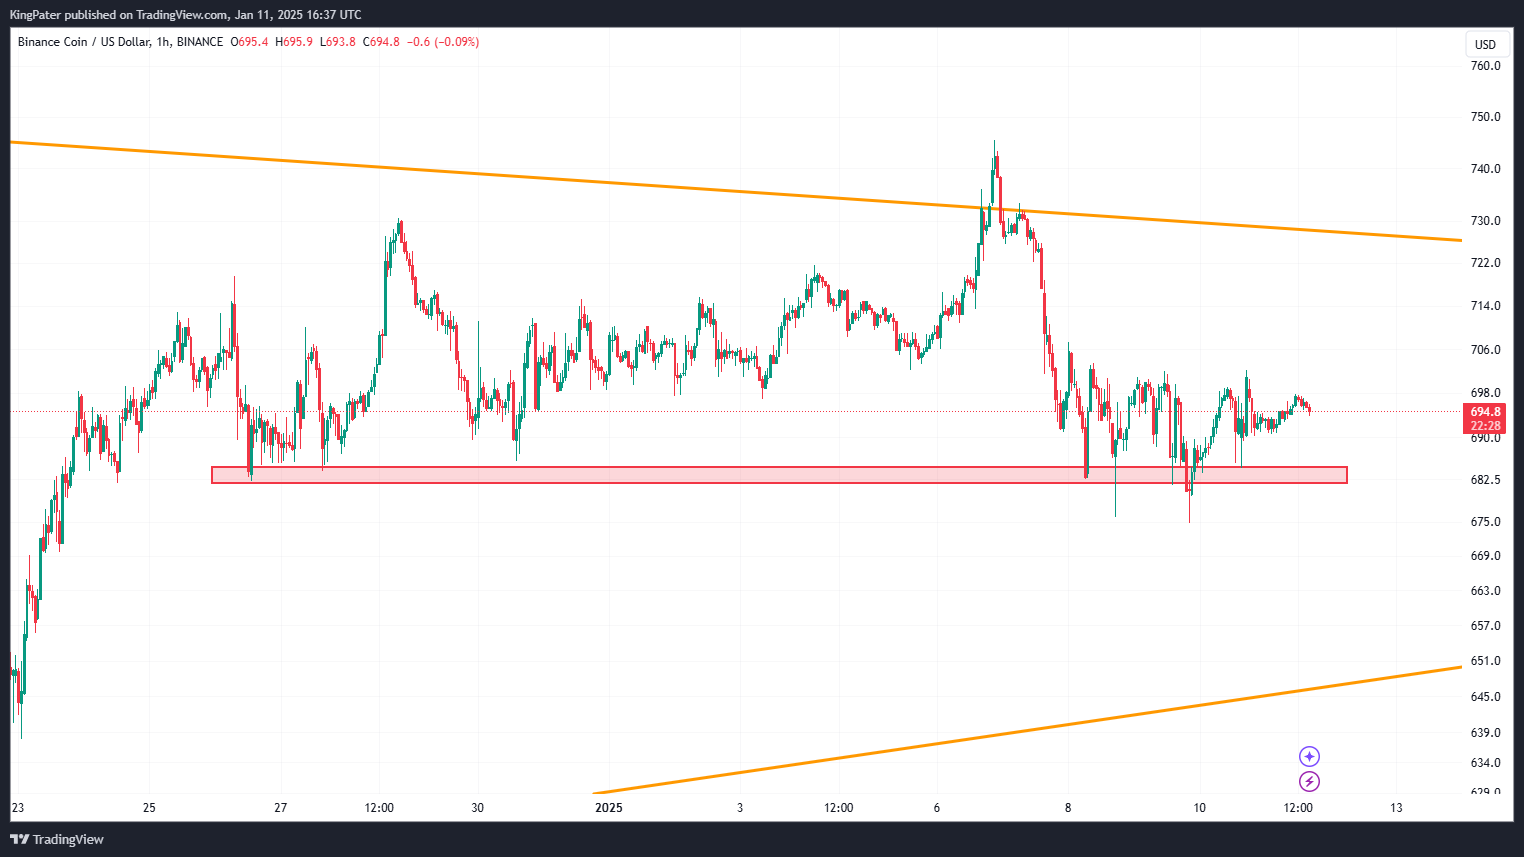
BNB/USDT Hourly chart. Source: TradingView.
READ MORE: Crypto Price Analysis – Solana (SOL), Ethereum (ETH), Toncoin (TON)