



- XRP price has formed a bullish double-bottom pattern on the daily chart.
- The spread of the three lines of the Bollinger Bands has narrowed this year.
- Ripple may surge despite the ongoing demand weakness.
XRP price has gone nowhere since February as the crypto winter has escalated. Ripple token was trading at $1.3515 on Saturday, down substantially from its all-time high of $3.65. Still, this consolidation may be calm before the storm, as it has formed a double-bottom pattern.
XRP Price Has Stalled as Key Network Metrics Struggle
Data shows that demand for the XRP token has largely evaporated during the ongoing crypto winter. For example, according to SoSoValue, spot XRP ETFs have added just $10 million in inflows this month.
While this is an improvement from last month’s $31 million outflow, it is still much lower than what happened last year. The funds added $666 million in inflows in November and $500 million in December. They now hold $968 million in assets.
The same trend is happening in the futures market, where the open interest has dropped to $2.4 billion from over $10 billion in August last year. Similarly, the weighted funding rate has stalled, a sign of weak market demand. CME futures demand has also stagnated.
READ MORE: Pepe Coin Price Prediction as Canary Files For New Spot PEPE ETF
Activity on the XRP Ledger has largely dried as well. The network has a total value locked (TVL) of just $46 million, well below that of other popular chains like Cardano and Solana. Also, early indications show that the permissioned DEX feature has not had a major impact on its activity.
At the same time, Ripple USD (RLUSD) growth has decelerated, with the market capitalization falling to $1.39 billion from $1.6 billion earlier this year. According to Artemis, RLUSD volume dropped to $9.1 billion over the last 30 days, while the number of transactions fell to 820k.
On-chain data shows the XRP burn rate has tumbled to less than 100 tokens per day. The number of active addresses and transactions has also pulled back.
On the positive side, crypto bull markets start when most metrics are struggling. A good example is the recent Pi Network surge before the Kraken listing and Pi Day, which came from nowhere.
Ripple Price Has Formed a Double Bottom Pattern
One key reason the XRP price may surge soon is that the token has formed a double bottom at $1.2807 and a neckline at $1.6067. A double bottom is a common reversal pattern that signals that short sellers are afraid to place positions below the price.
The Average True Range (ATR), a common volatility indicator, has dropped to its lowest level in over a year. Most importantly, the spread between the three lines of the Bollinger Bands has narrowed.
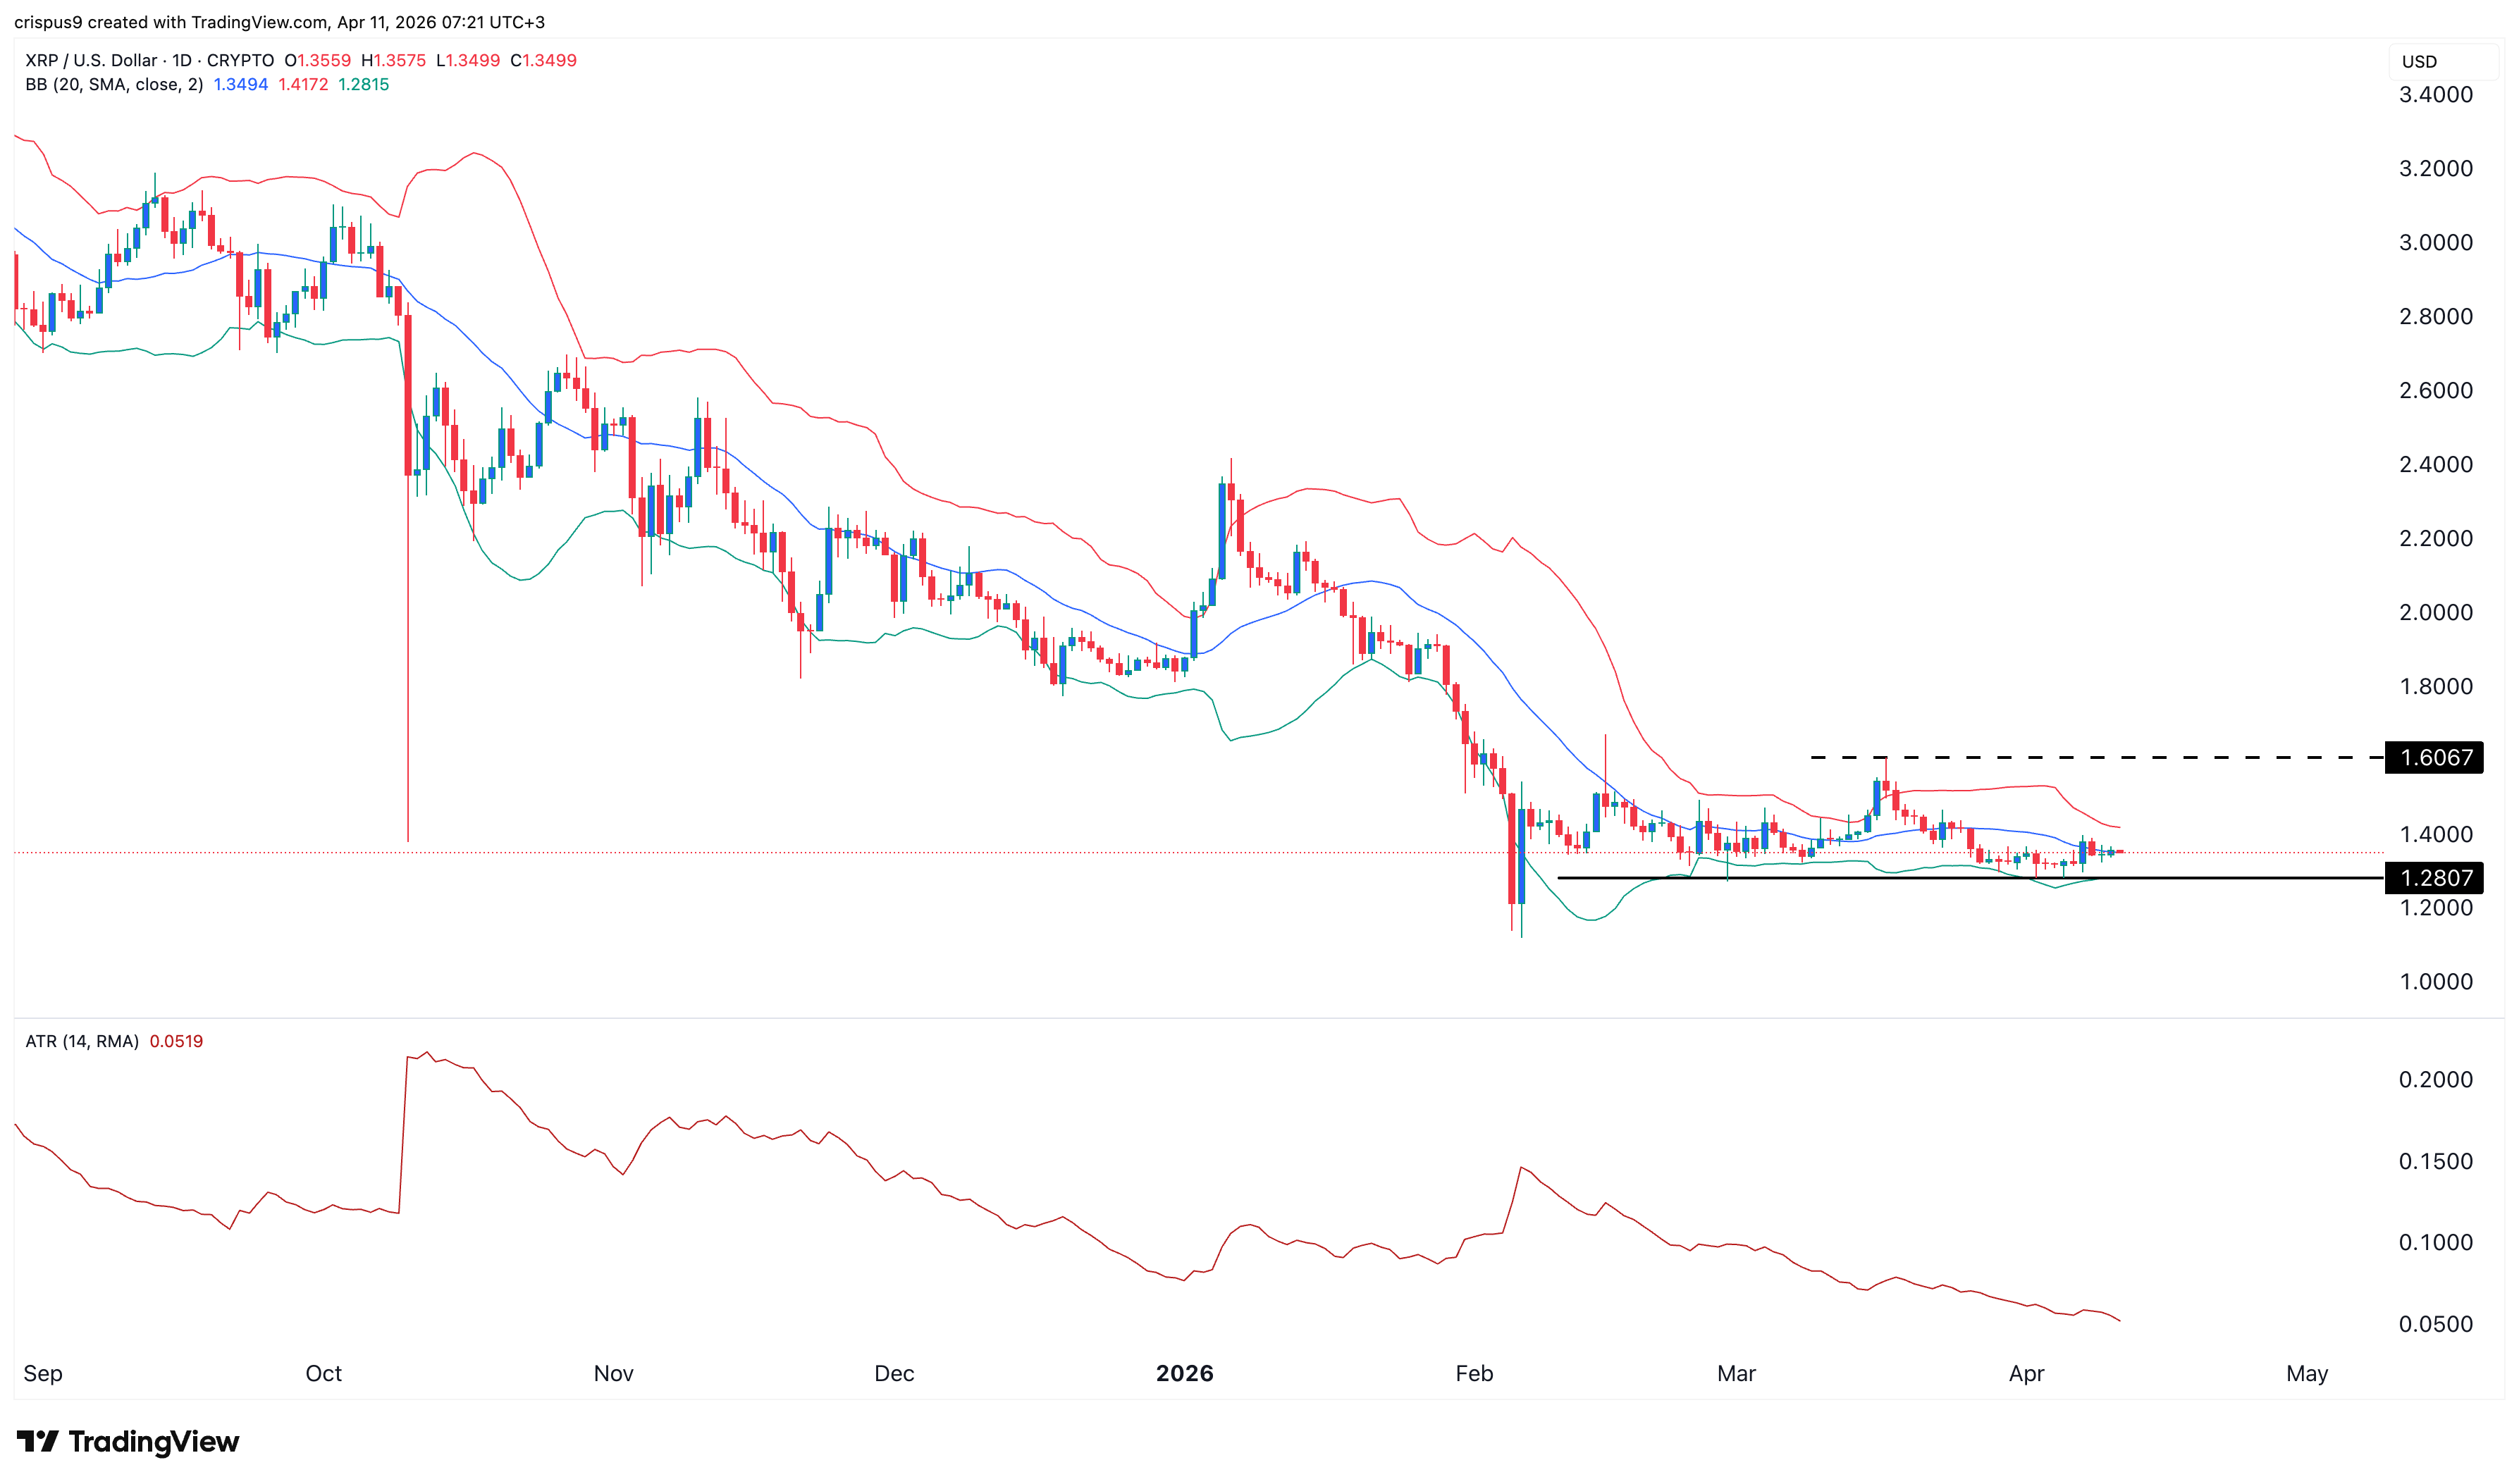
These indicators point to a Bollinger Band squeeze in the near future. If this happens, the initial target price will be at $1.6067, its highest point in March this year. A surge above that will point to further gains to $2. On the other hand, a drop below the double-bottom point at $1.2800 will invalidate the bullish outlook.
READ MORE: Zcash, Dash, Monero Prices Jump as Iran Considers Crypto for Strait of Hormuz Tolls