


Dogecoin price has gone nowhere over the past two months as demand for its ETFs has continued to wane, and a senior Senator issued warnings about Elon Musk’s X Money service launching this month. DOGE token was trading at $0.095 on Thursday, down sharply from the year-to-date high of $0.155.
DOGE ETF Inflows Fade, Elizabeth Warren Blasts X Money
The Dogecoin price has moved sideways over the past few months, as data shows investors are no longer buying spot DOGE ETFs.
The funds have added just over $1.15 million in assets this year, bringing the total net assets to just $10 million. Its total assets are just 0.08% of the DOGE market capitalization.
Dogecoin ETFs have underperformed other altcoin funds this year. For example, Solana ETFs have soared to over $817 million, while XRP has $978 million. Chainlink funds have over $98.3 million, while Hedera has over $49 million.
READ MORE: Circle Stock Analysis: Elliot Wave Pattern Points to a Jump to $200
Meanwhile, Dogecoin price wavered after Senator Elizabeth Warren blasted Elon Musk’s X Money service, which launches this month. In a lengthy letter, the Massachusetts senator warned that the service will put Americans at risk. He cited Musk’s goal of turning X into a super app like WeChat and AliPay.
Warren also warned about Cross River Bank, its partner, which has gone through legal issues in the past. Also, he pointed out that the launch comes after Musk contributed to the collapse of the Consumer Financial Protection Bureau (CFPB).
Crypto analysts have pointed to the launch of X Money as a major catalyst for Dogecoin, given that Elon Musk was its biggest booster. However, it is unclear how Dogecoin will be implemented in the platform. Instead, it is likely to leverage stablecoins.
Dogecoin Price Prediction: Technical Analysis
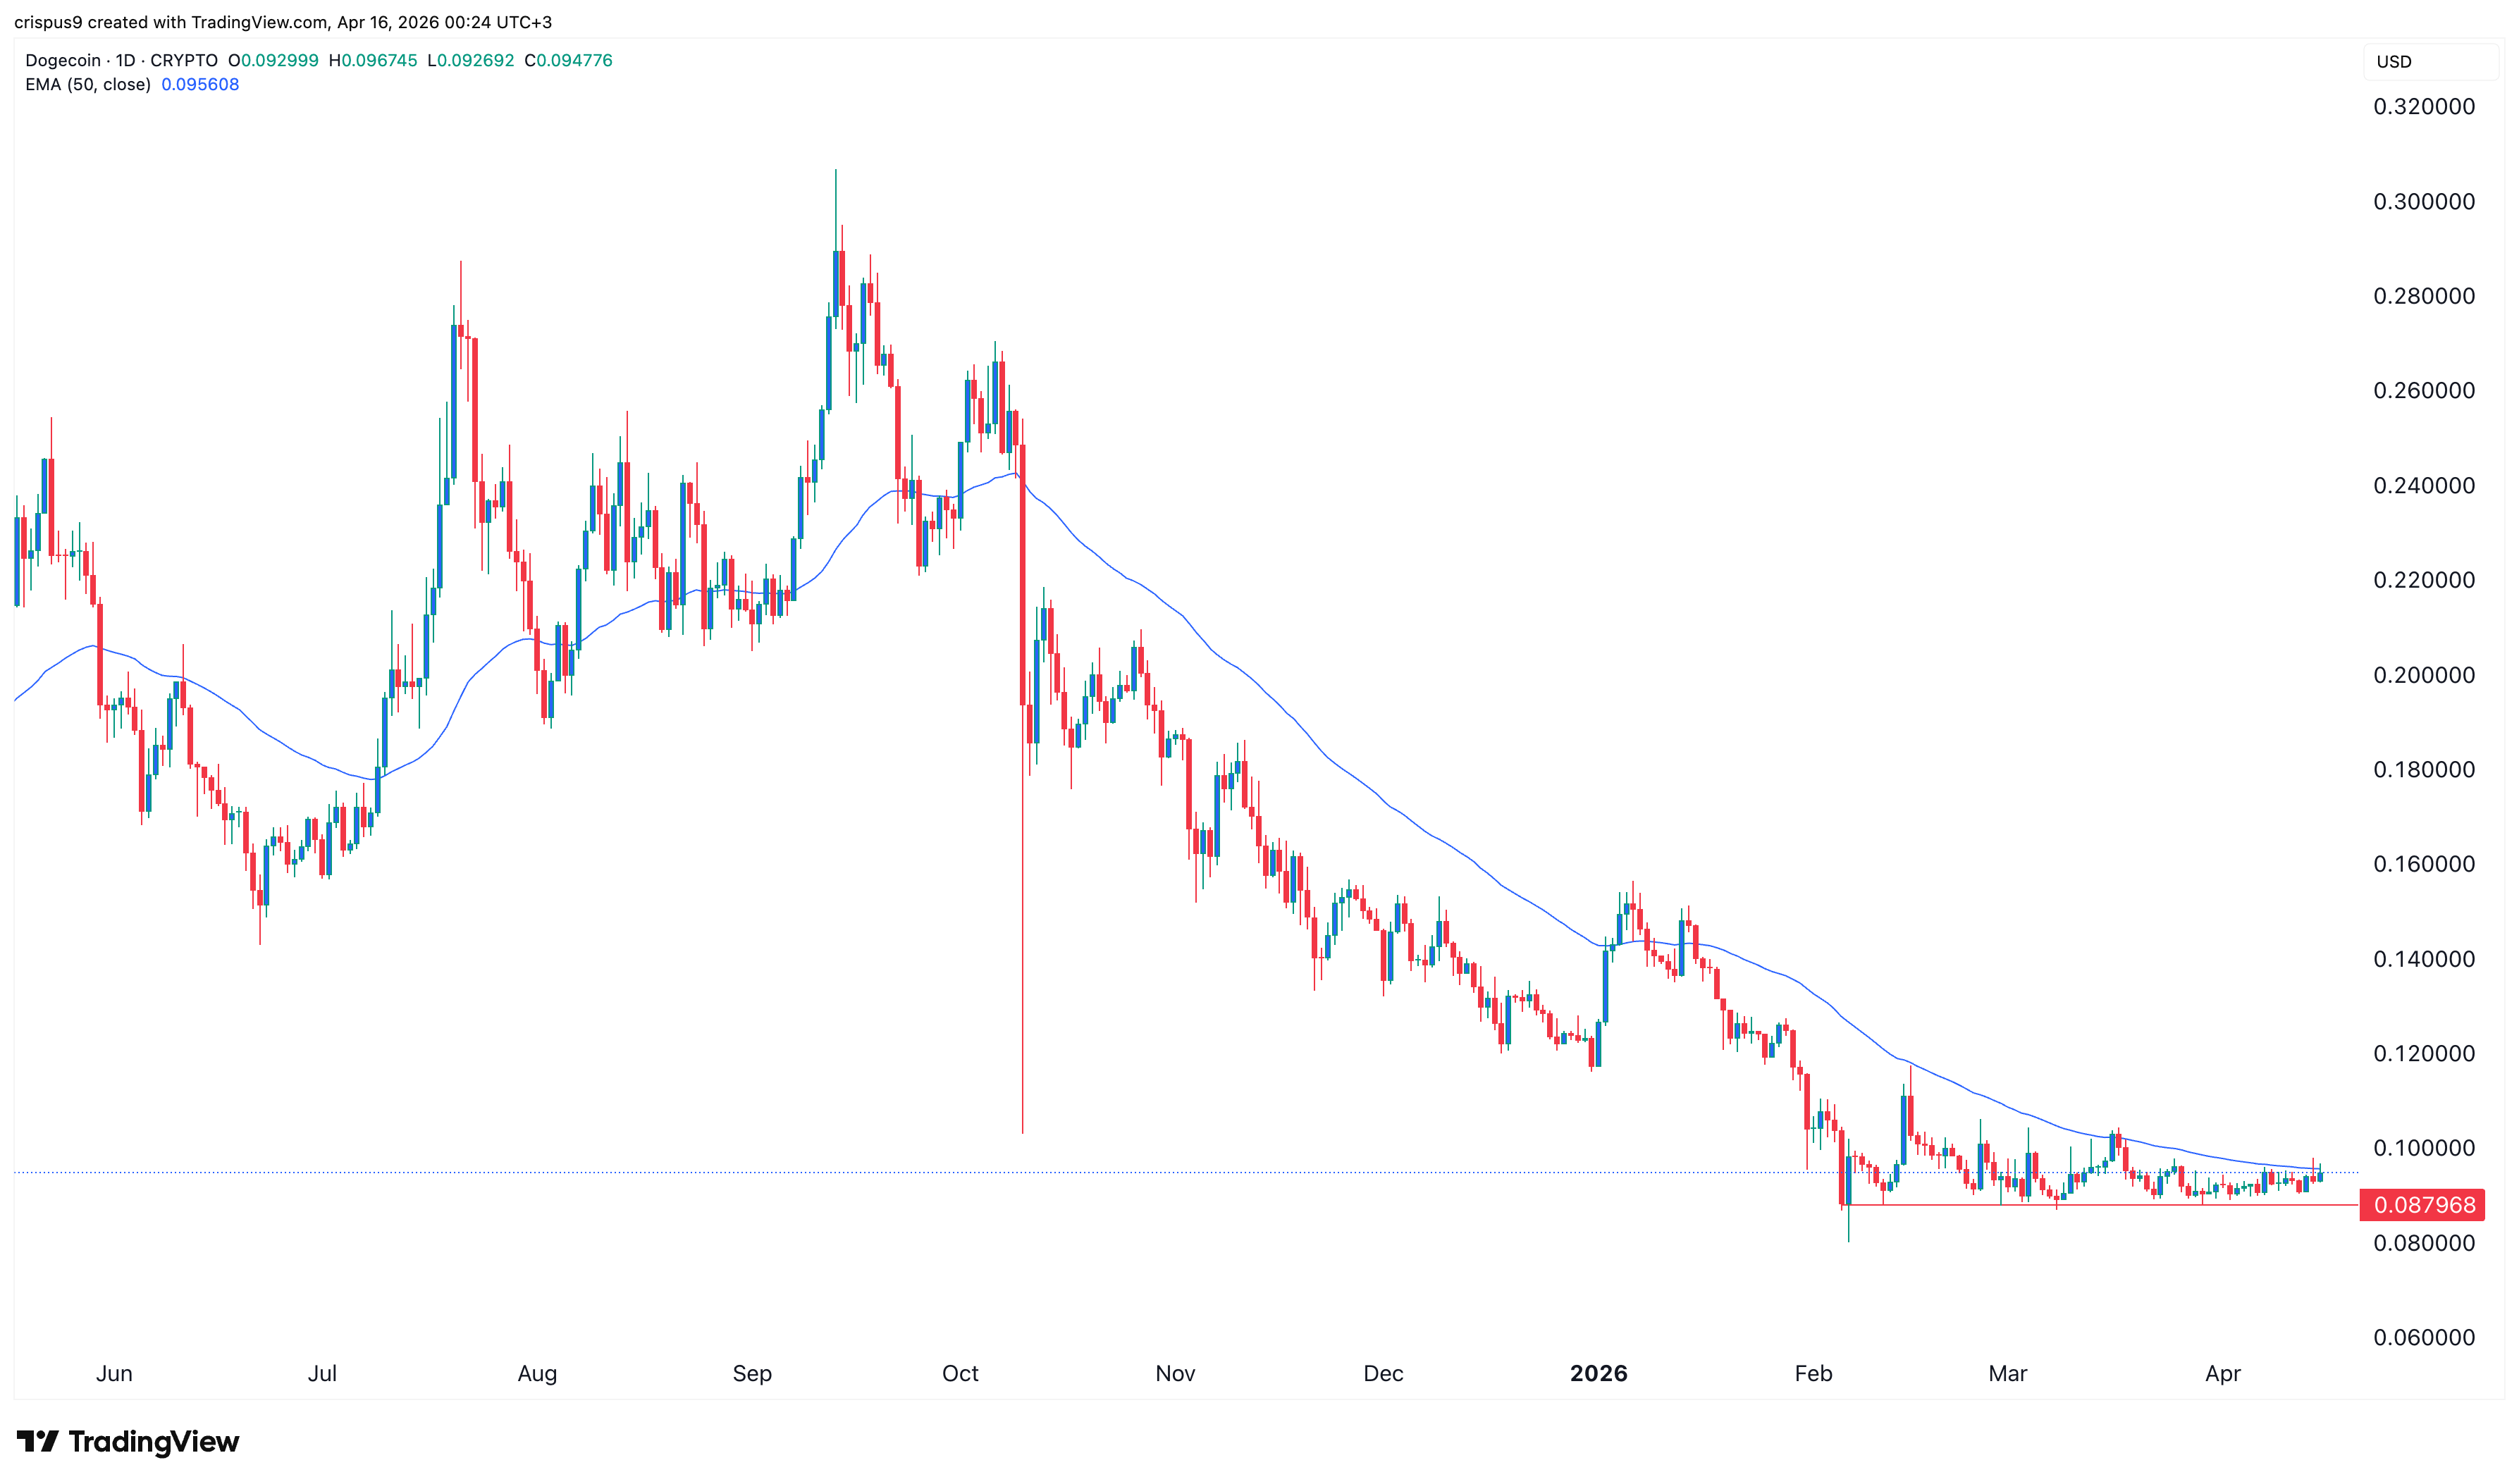
The daily timeframe chart shows that DOGE has traded in a narrow range over the past few months. It has remained at $0.0947, a few points above the year-to-date low of $0.0795.
The token has formed a double-bottom pattern, with the neckline at $0.1030, its March high. A double-bottom is one of the most common bullish reversal signs in technical analysis.
Therefore, there is a likelihood the token will have a strong bullish breakout, potentially to the key resistance level at $0.1030. A move above that level will point to gains of $0.12, up by 25% above the current level.
On the other hand, a drop below the key support level at $0.087 will invalidate the bullish outlook and signal further downside, potentially to the key support level at $0.05.
READ MORE: SharpLink Stock Analysis: Here’s Why This BitMine Rival is Set to Go Parabolic