- Bitcoin price has moved into a bull market after rising by over 20% from the year-to-date low.
- The Crypto Fear and Greed Index is approaching the green zone.
- Technical analysis points to an eventual rebound to the key resistance level at $93,000.
Bitcoin price has stalled at the crucial $75,000 resistance level, with bulls hesitant to place trades above it. Still, with the S&P 500 and Nasdaq 100 indices trading at all-time highs, there’s a chance the coin will surge as the Fear and Greed Index jumps.
Crypto Fear and Greed Index is Rising
Bitcoin price has several potential bullish catalysts that could push it higher in the coming weeks or days.
First, there are signs that investors are embracing a risk-on sentiment, with the US Dollar Index (DXY) falling and the US stock market soaring to a record high.
Most notably, the Crypto Fear and Greed Index may soon jump to the greed zone for the first time in months. In most cases, this performance leads to a strong crypto market rally because BTC is considered a risky asset.
READ MORE: MSTR Stock Alarming Pattern Points to a Crash to $100 as Risks Remain
The CNN Money Fear and Greed Index, which dropped to 20 last month, has already moved to the greed zone of 62.
Second, there are signs that American investors are accumulating the token. Data shows that spot Bitcoin ETFs have added over $1 billion in inflows so far this month. These funds will likely exceed the $1.3 billion added last month.
Third, the biggest American companies are deepening their presence in Bitcoin. Morgan Stanley recently launched a spot Bitcoin ETF that has added over $100 million in assets in just a week. Also, BlackRock and Goldman Sachs are working on their covered call ETFs, which will be launched later this year.
Additionally, Bitcoin price is benefiting from the ongoing stock market surge, which has pushed the S&P 500 and Nasdaq 100 indices to record highs this year. In most cases, these indices do well, and the crypto market soars.
Bitcoin Price Technical Analysis
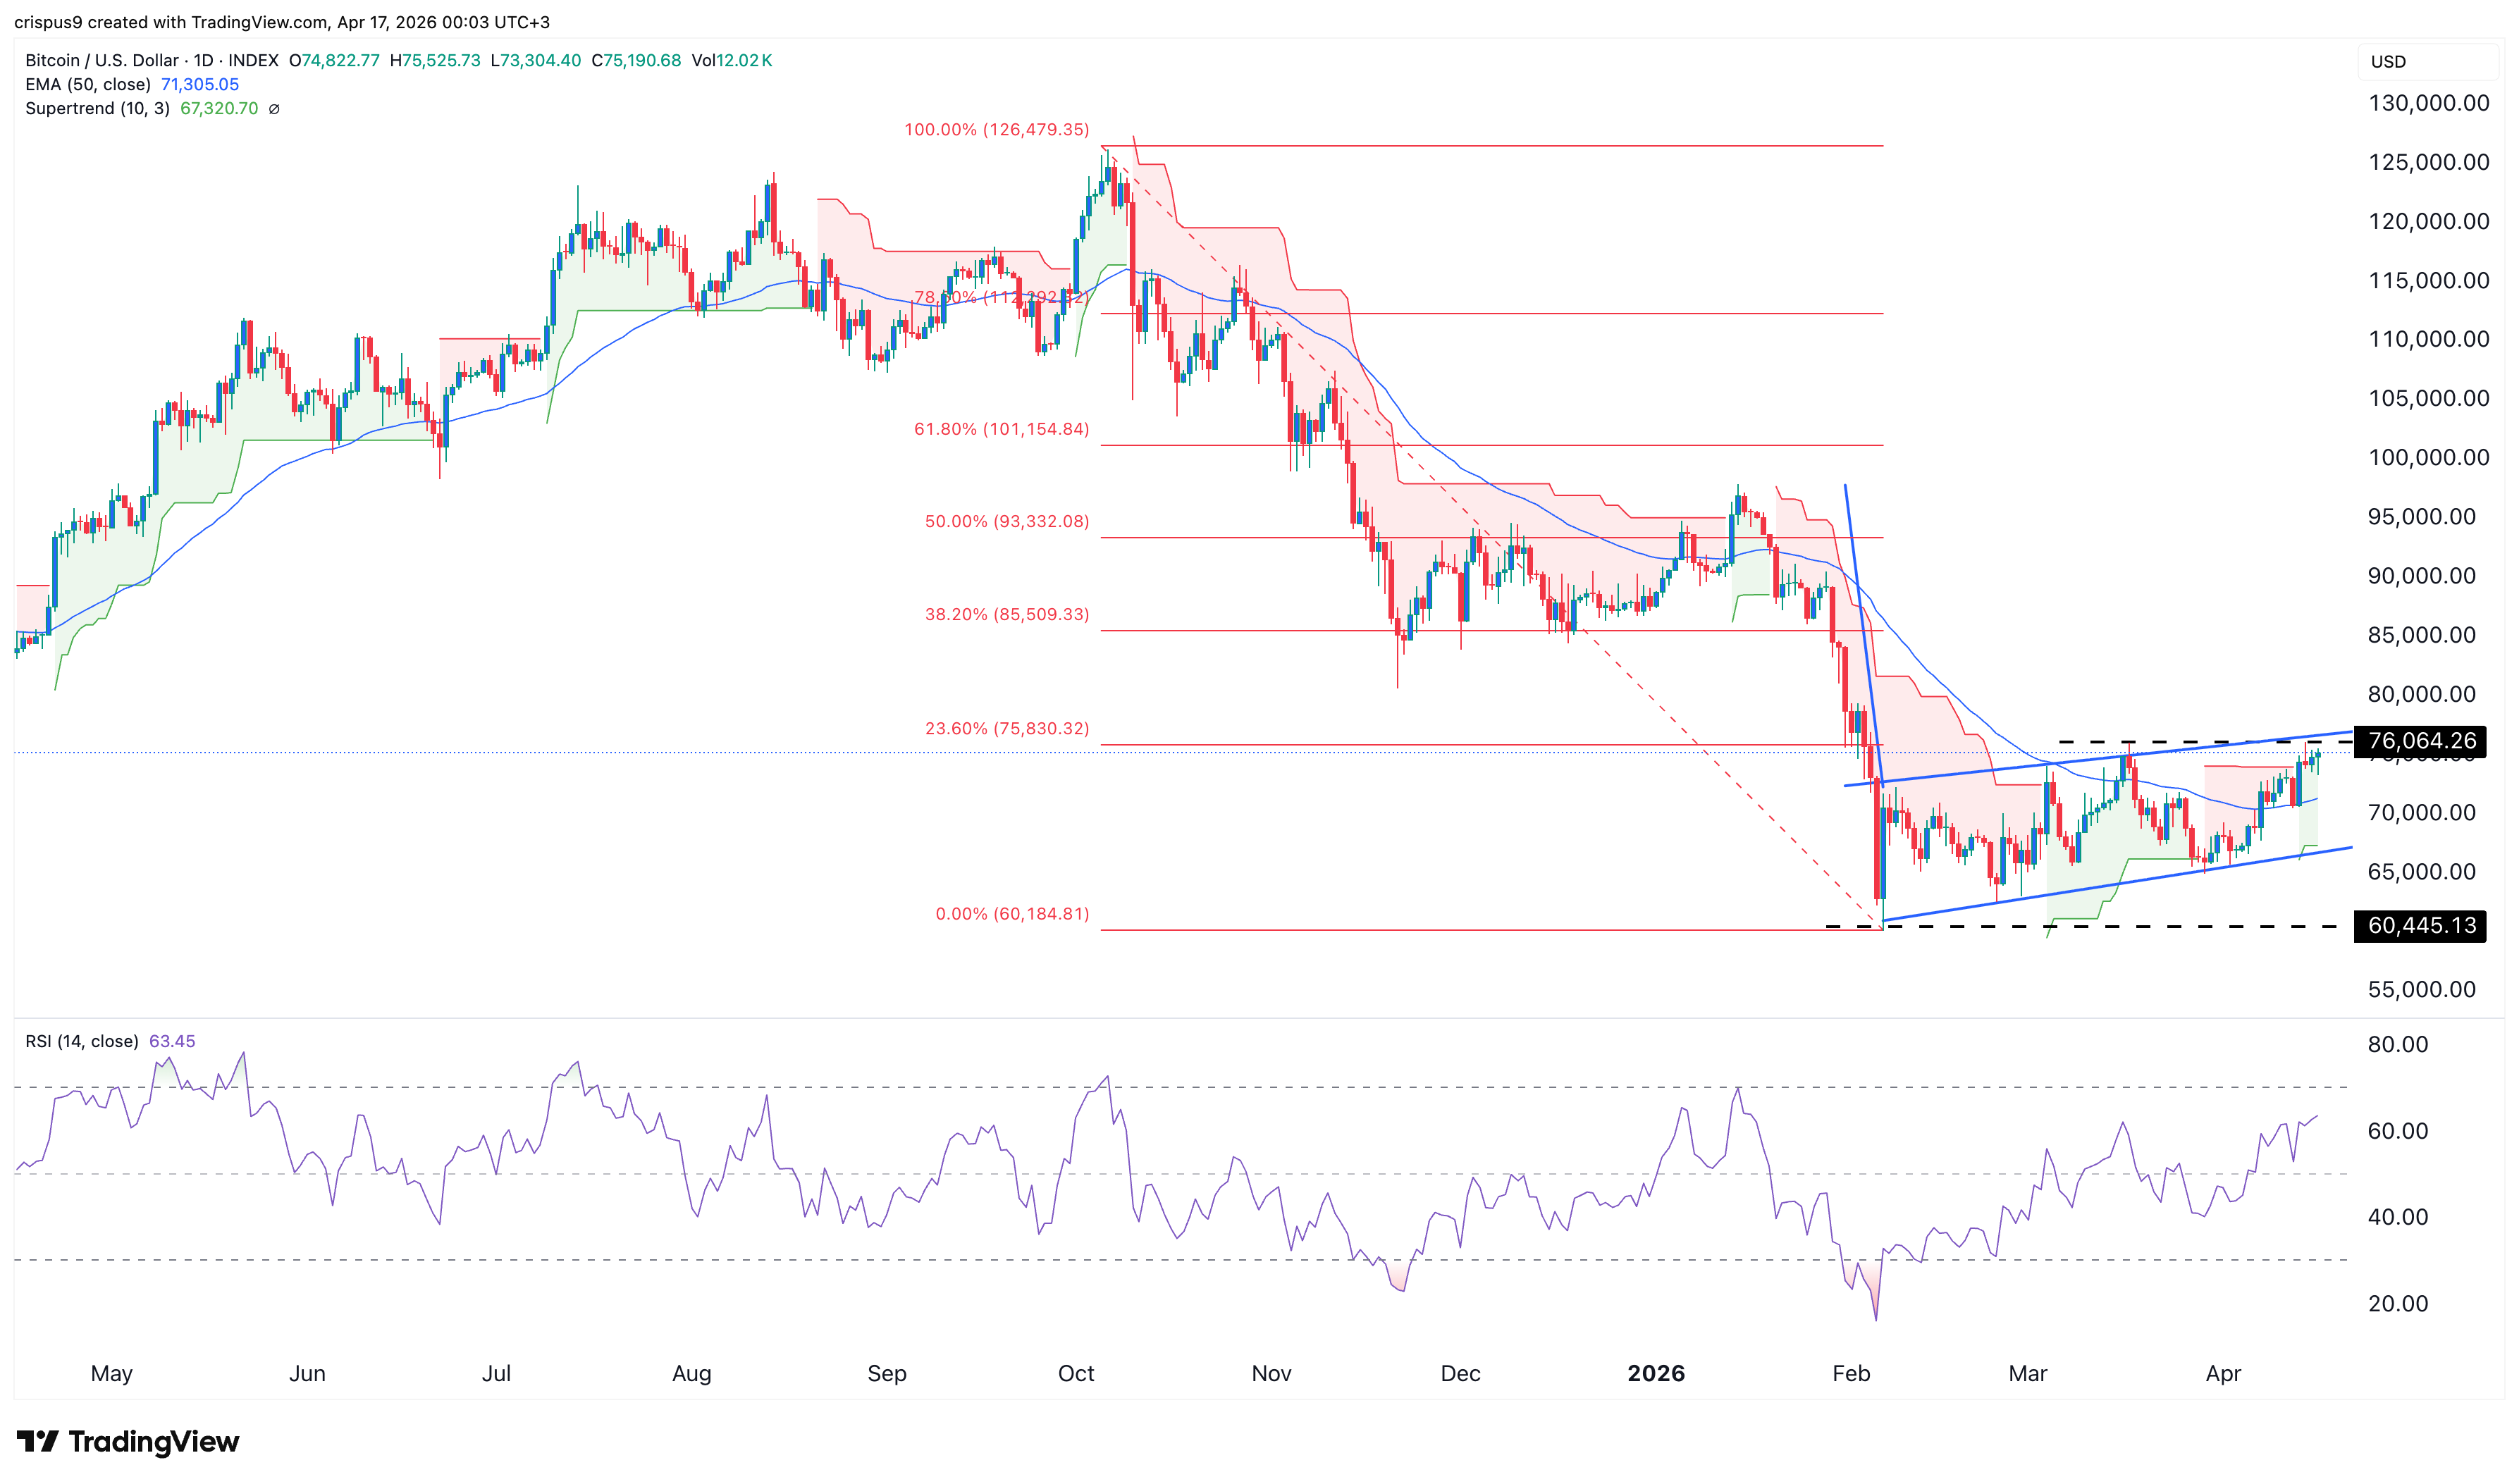
The daily timeframe chart shows that the BTC price has staged a strong comeback recently. However, it is struggling to move above the upper side of the ascending channel, which coincides with the 23.6% Fibonacci Retracement level.
The coin has jumped above the 50-day moving average. It has also flipped the Supertrend indicator from red to green, a common bullish signal.
The Relative Strength Index (RSI) has jumped to over 60. Therefore, the most likely scenario is that the token continues to rise in the near term.
This view will be confirmed if it moves above the channel’s upper limit. If this happens, it will likely continue rising as bulls target the 50% retracement level at $93,300.
READ MORE: Nebius Stock May Soar 50% as C&H Forms Amid Relentless Growth