


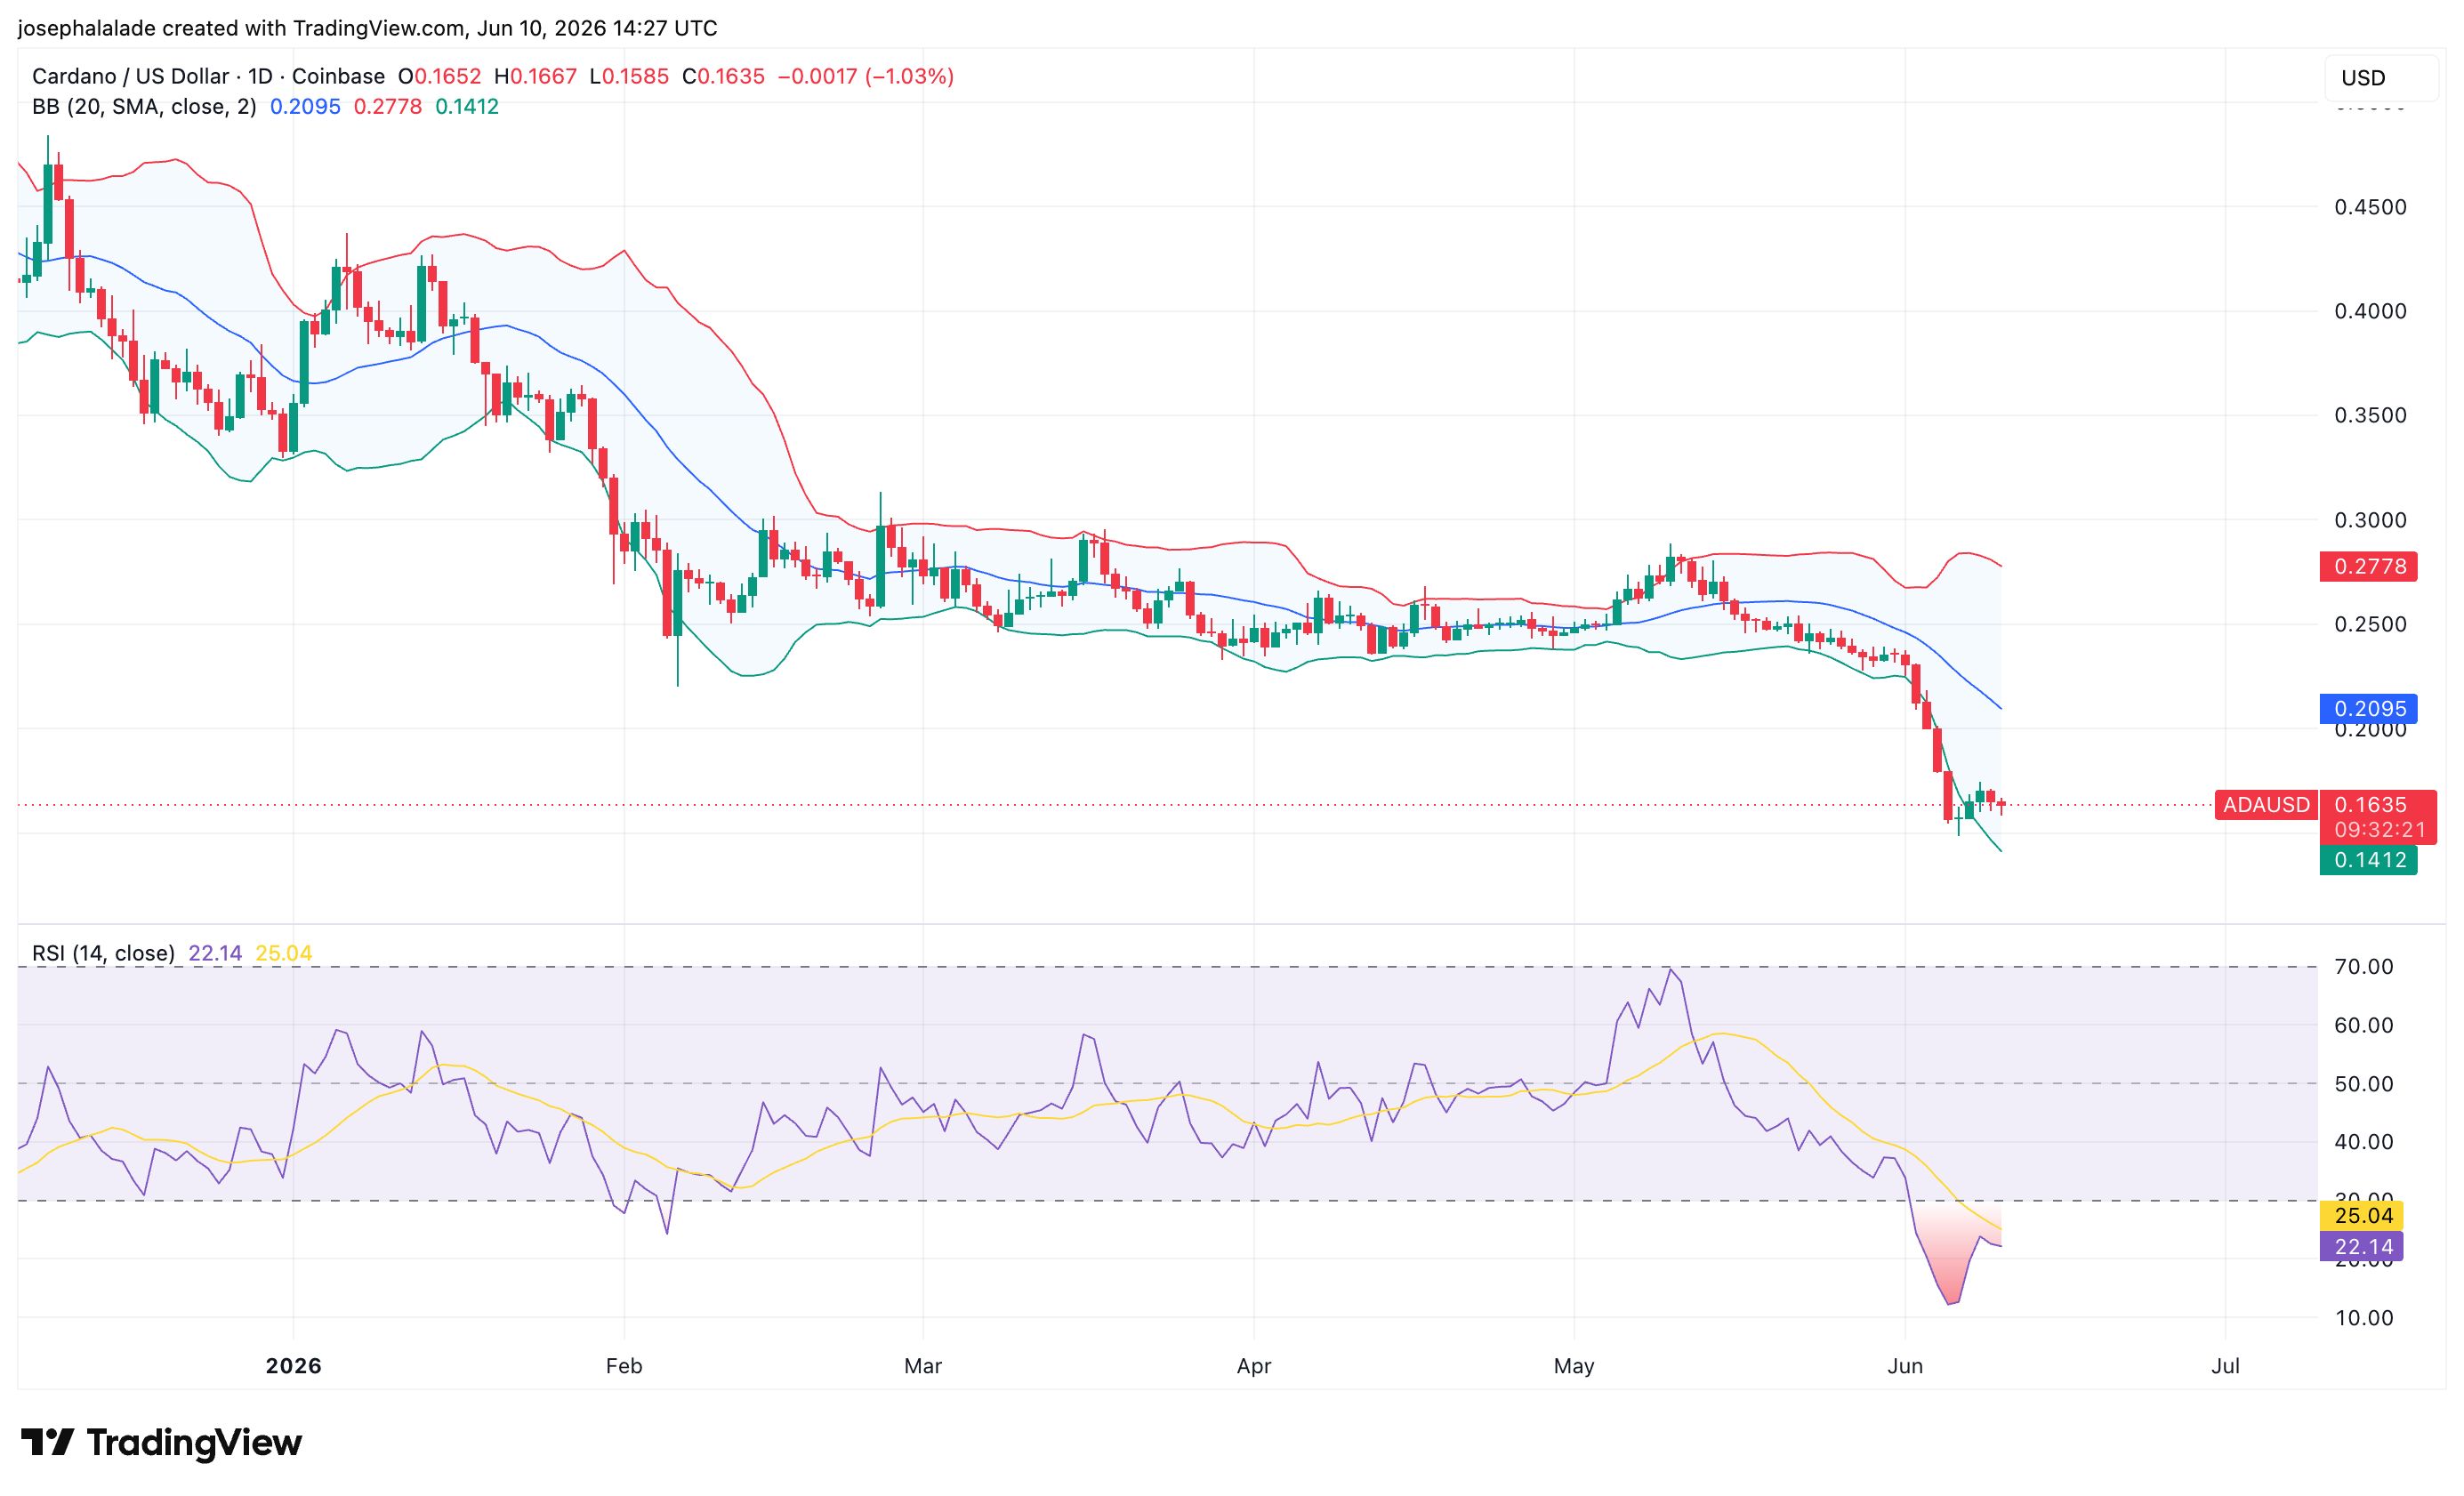
Cardano (ADA) is holding around $0.1643 on Wednesday after a steep drop in 2026. The price fell 22.80% this week, 41.86% this month, and over 61% in six months, putting ADA about 90% below its all-time high. The daily chart shows the Cardano price falling from $0.28 in May 2026 to around $0.15, breaking out of the $0.23-$0.28 range it had traded in from February to May.
This breakdown is critical, as dropping below $0.23 turned months of sideways trading into a period of higher volatility. The ADA price fell below the lower Bollinger Band at $0.1412, then recovered and closed at $0.1632. The RSI also dropped to 22.06, one of ADA’s most oversold levels in recent months.
Being oversold does not mean the decline is over, and on-chain data provides more detail on the outlook. Santiment reported several spikes in Age Consumed over the past four or five days. The biggest spike since April happened on June 9. Meanwhile, the Mean Dollar Invested Age, which had been rising, paused for the first time in five weeks.
These metrics suggest that ADA, which had been inactive for a while, is now moving again. In the past, similar patterns and pauses in the investment-age curve have often occurred near market turning points. This shows that the recent drop has brought long-term holders back into the market.
Cardano Price Recovery Hinges on $0.21 as Delisting Weighs on Sentiment
Other factors are also weighing on the price. Binance will remove seven spot trading pairs, including ADA/BNB, on June 12 after a regular liquidity review. This is not a full token delisting, but it does force traders to exit those pairs and can create short-term selling pressure.
Sentiment worsened after founder Charles Hoskinson called the Cardano Foundation his “worst mistake” and announced he would stop making public videos, interviews, and posts on X to focus on development.
The market still favors sellers. The Cardano price is below the 20-day moving average, the Bollinger midpoint is dropping at $0.2095, and there have been several lower highs. A likely scenario is a short-term bounce to $0.18, then possibly to the $0.20 level and the $0.209 20-day moving average.
If the ADA price moves back above the midband, it would be the first sign that selling momentum is slowing. The $0.23 level would likely limit any bigger move toward the $0.278 upper band. If the price falls below $0.15, the $0.141 lower band becomes the next support, followed by $0.12 and $0.10.
Any Cardano price prediction depends on this level. Unless ADA moves back above the 20-day average near $0.21 and starts forming higher highs, every price move will look like a correction. For ADA traders, the $0.14-$0.15 range is short-term support, and the return of large holders to the market is an important factor to watch.
READ MORE: NEAR Adds Hyperliquid Perps, Unlocking 50+ Markets and 40x Leverage