


Bitcoin price rose for four consecutive weeks and is now hovering at its highest swing since February 17. BTC has surged by over 30% and is a few points below the all-time high of $109,200.
Analysts have made their bullish Bitcoin predictions in the past few weeks. Ark Invest expects that the coin will surge to $2.4 million by 2030, while Standard Chartered sees it rising to $120,000 initially and then soaring to $200,000 eventually.
All these BTC forecasts seem surreal. However, a closer look at at least three charts will explain why these predictions may be real.
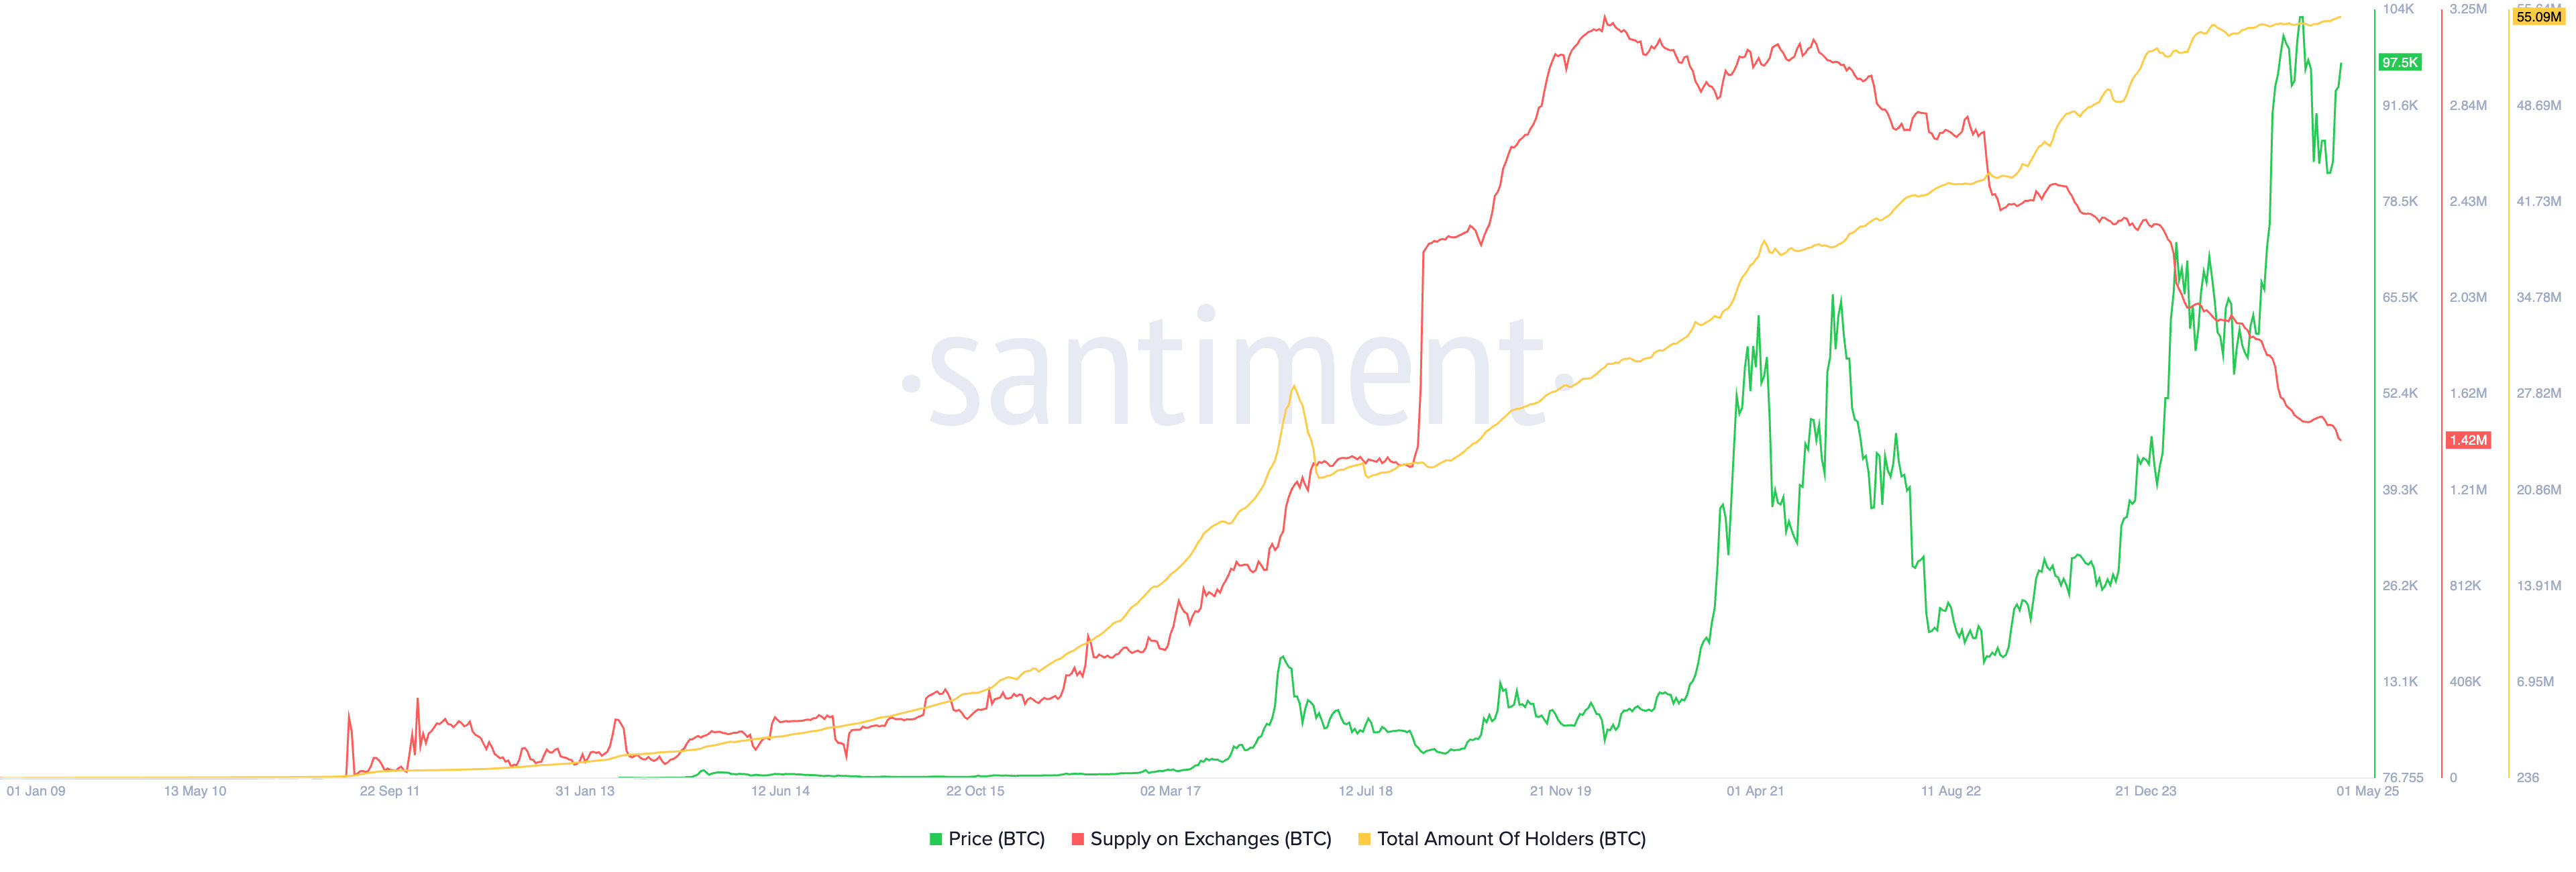
Bitcoin Supply on Exchanges is Tumbling
The first highly bullish Bitcoin price catalyst is the fact that Bitcoin’s supply is running out. One of the best metrics to look at is the supply in exchanges. Santiment data shows that the supply is in a freefall and currently sits at its lowest level in five years.
There are 1.42 million Bitcoins in exchanges today, down from 3.18 million in 2019, a 60% crash. This is essential data because it signals that Bitcoin holders maintain them in their wallets.
This trend has become more pronounced as Bitcoins worth over $100 billion are moving out of exchanges and being accumulated by many companies.
READ MORE: Bitcoin Price Prediction: Will BTC Surge to a New ATH This Week?
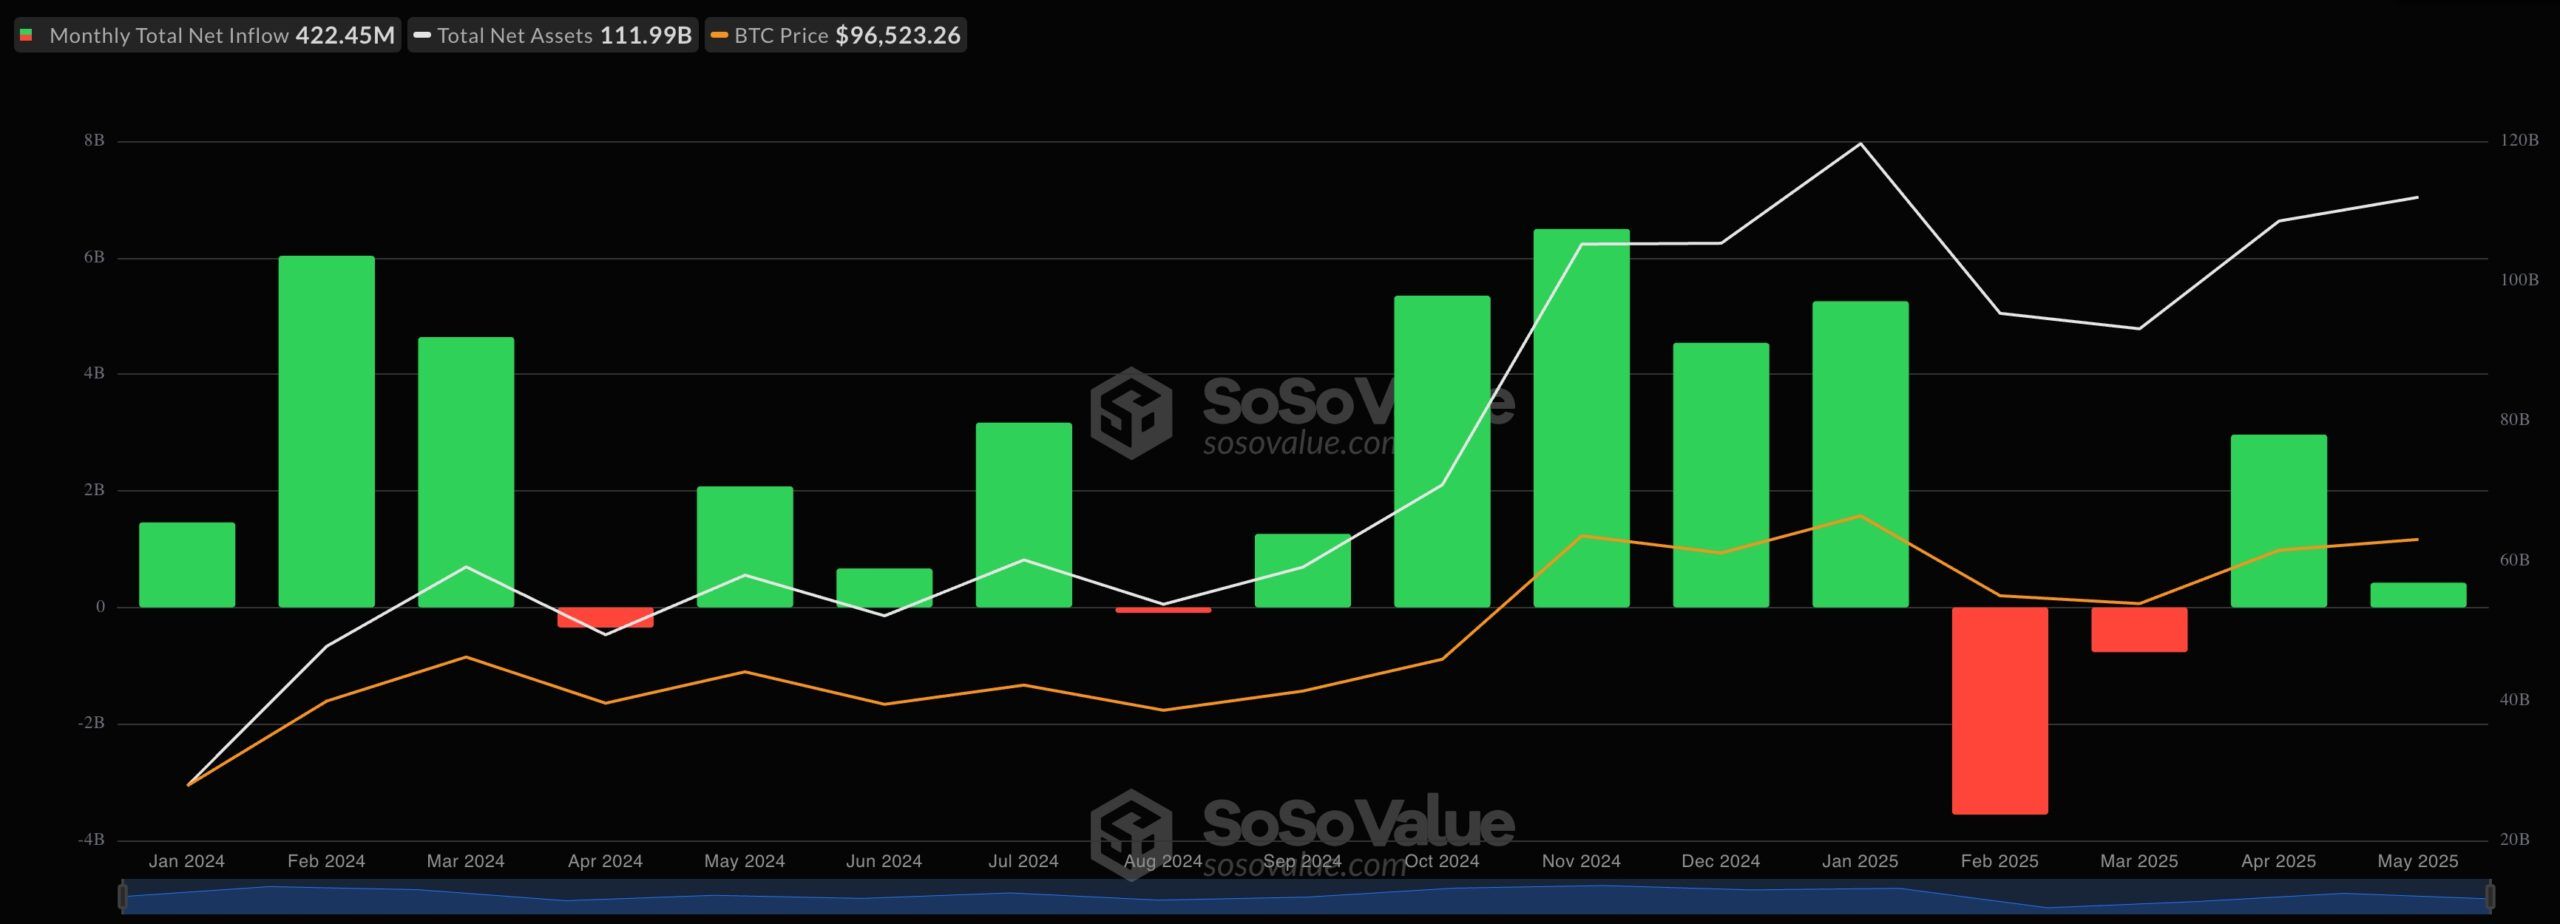
Bitcoin Demand is Rising
The other chart to look at is on demand. First, the chart above shows that the total number of Bitcoin holders has been on an upward trajectory. It has risen to 55 million, up from less than 500k a decade ago. This is a sign that demand remains resilient.
Second, the chart below shows that spot Bitcoin ETFs are seeing substantial inflows. Since their inception in January last year, they have had just four months of outflows. The funds have added almost $40 billion in inflows, bringing their total assets to $112 billion.
These two charts show an asset whose demand is surging while the supply is falling, creating the perfect scenario for a price increase.
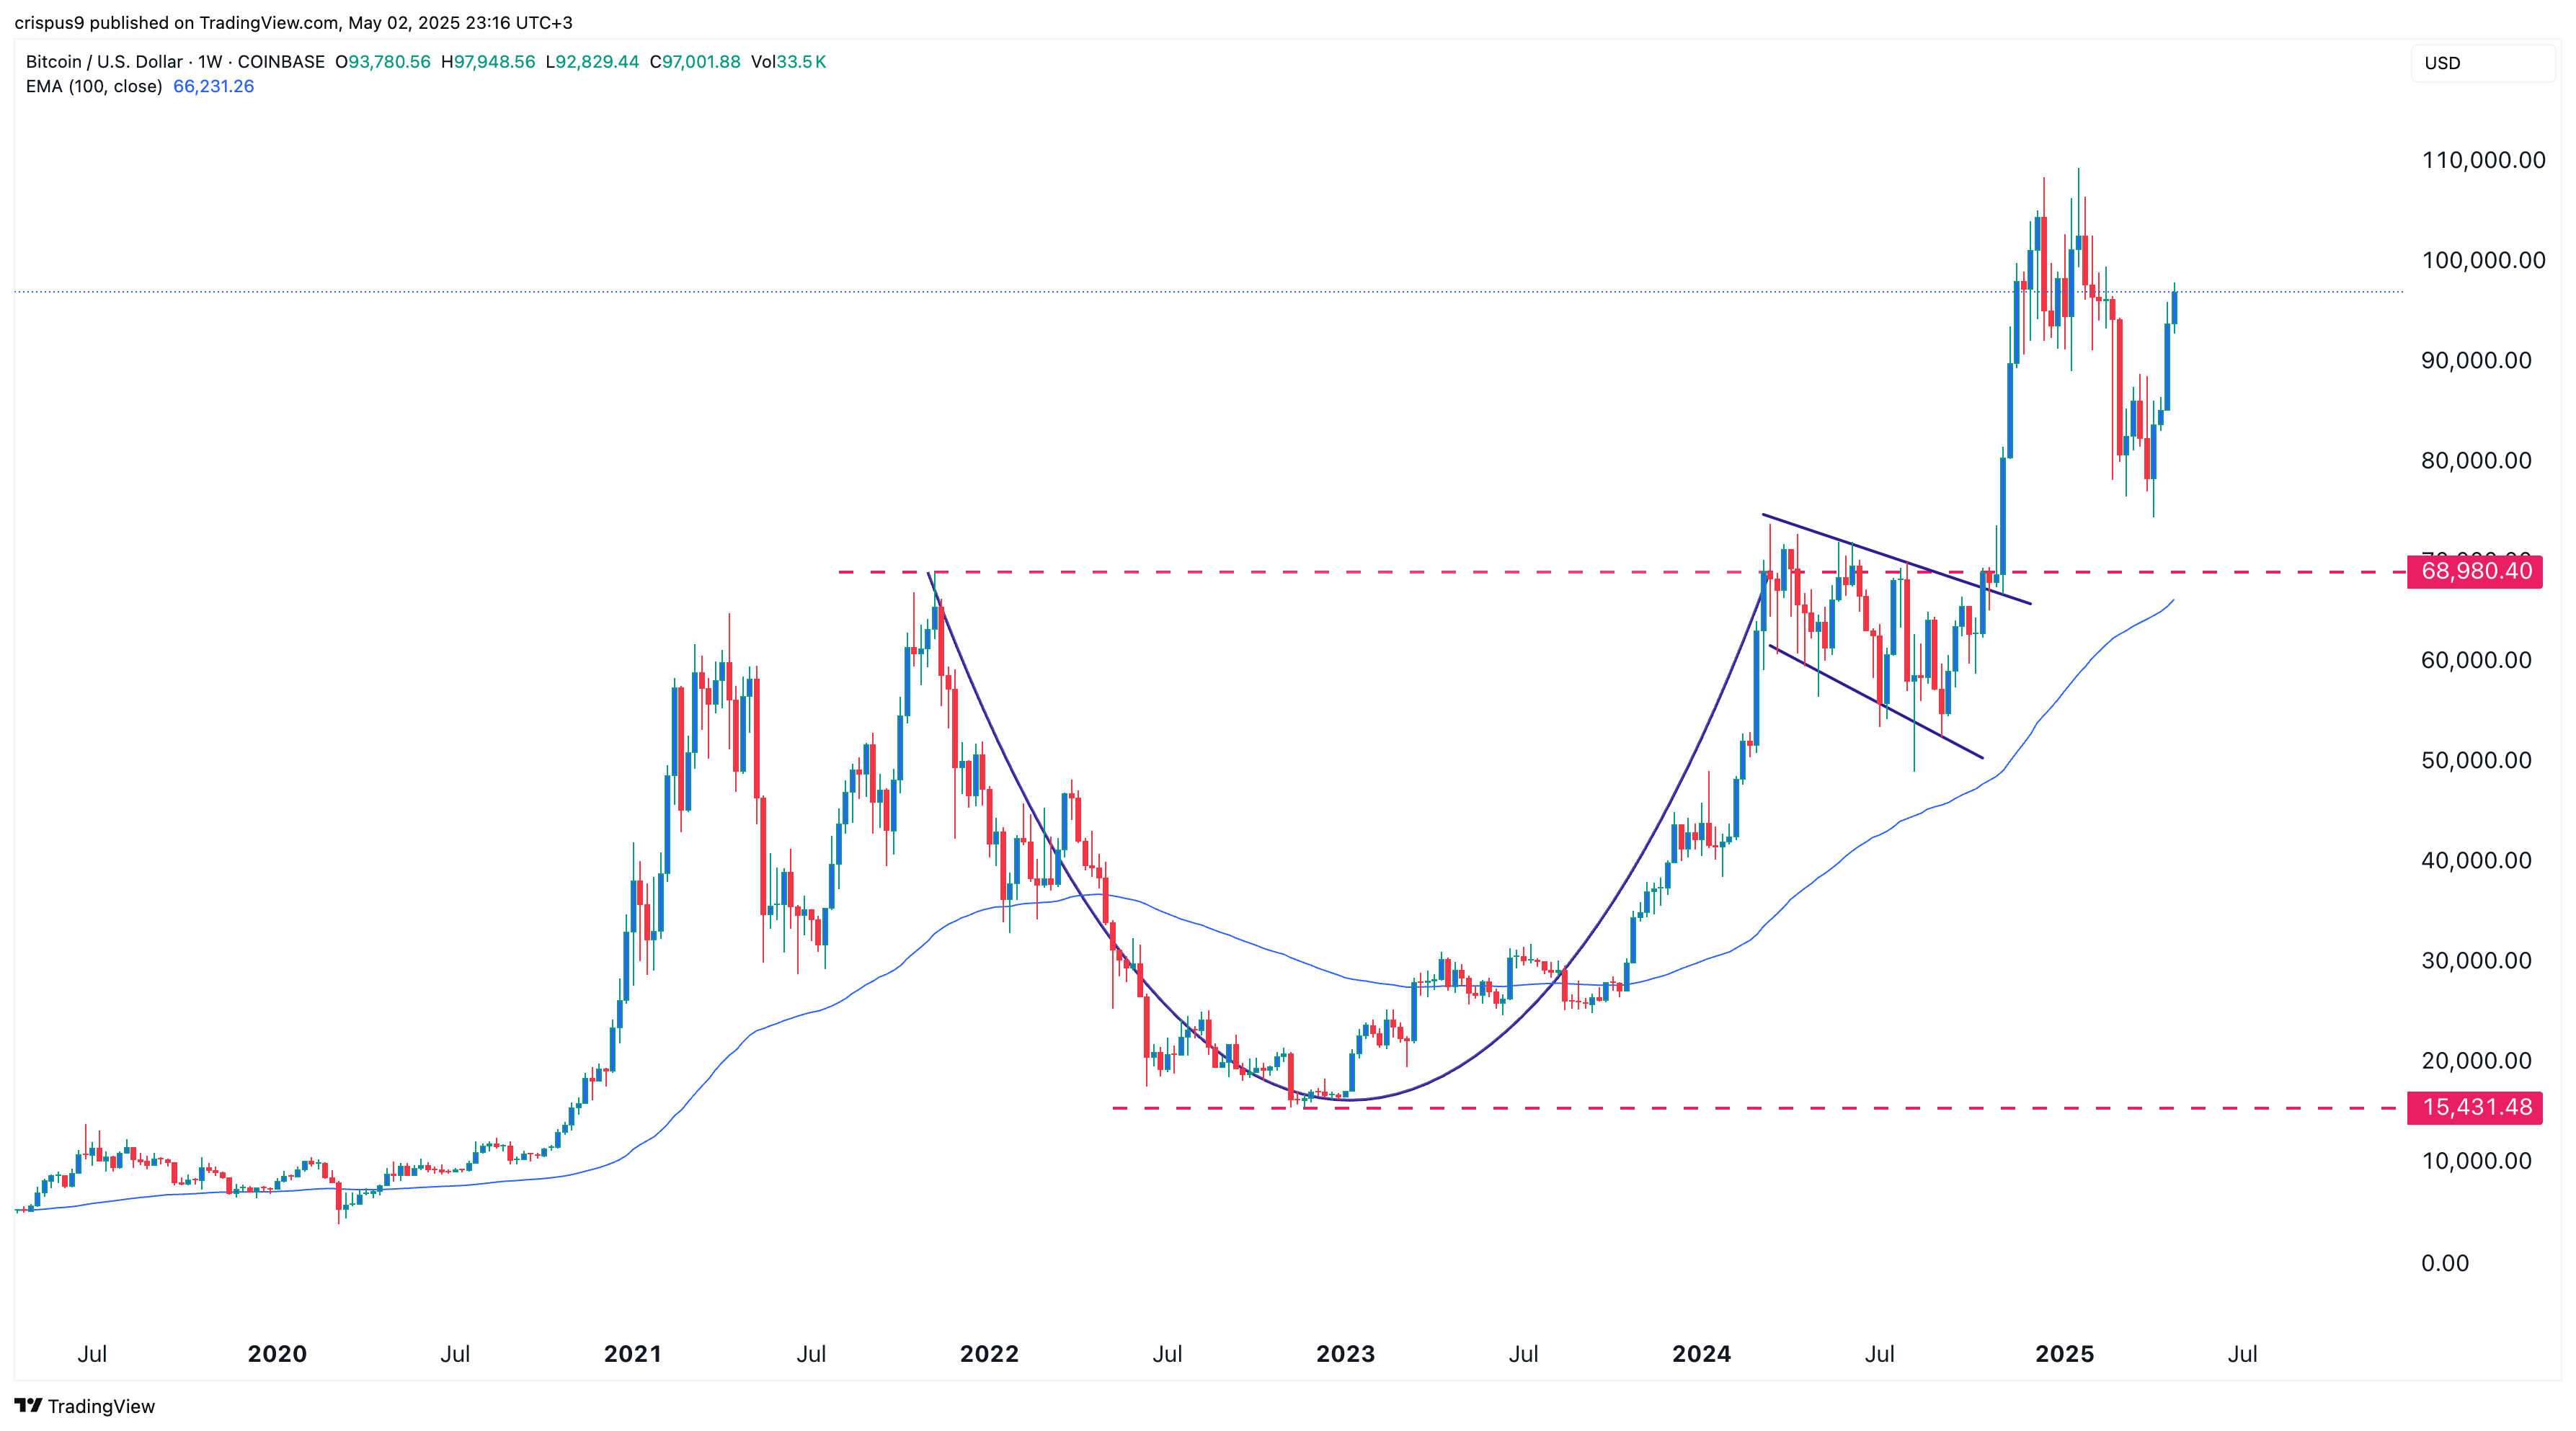
Bitcoin Price Weekly Chart Shows the Bull Run is Still on
The final important Bitcoin chart to look at is its long-term one. The weekly chart below shows that the Bitcoin price has been in a bullish trend for a long time. This rally is supported by the 100-week moving average as the coin has remained constantly above it.
The chart also shows that the Bitcoin price has always recovered whenever it has experienced a dive. For example, it crashed from $68,980 in November 2021 to $15,430 in November 2022. It eventually bounced back and moved to its all-time high of $109,300.
The bottom line
Technical indicators and fundamental analysis suggest that the Bitcoin price rally is just getting started. While it is hard to estimate the exact price, it is likely to continue soaring in the next few years.