


Dogecoin price has crashed this year, wiping out billions of dollars in value. Still, there are signs that the DOGE token is about to surge after it formed a highly bullish classical chart pattern. It trades at $0.1700, up from this week’s low of $0.1467.
Dogecoin Price Classical Chart Signals a Rebound
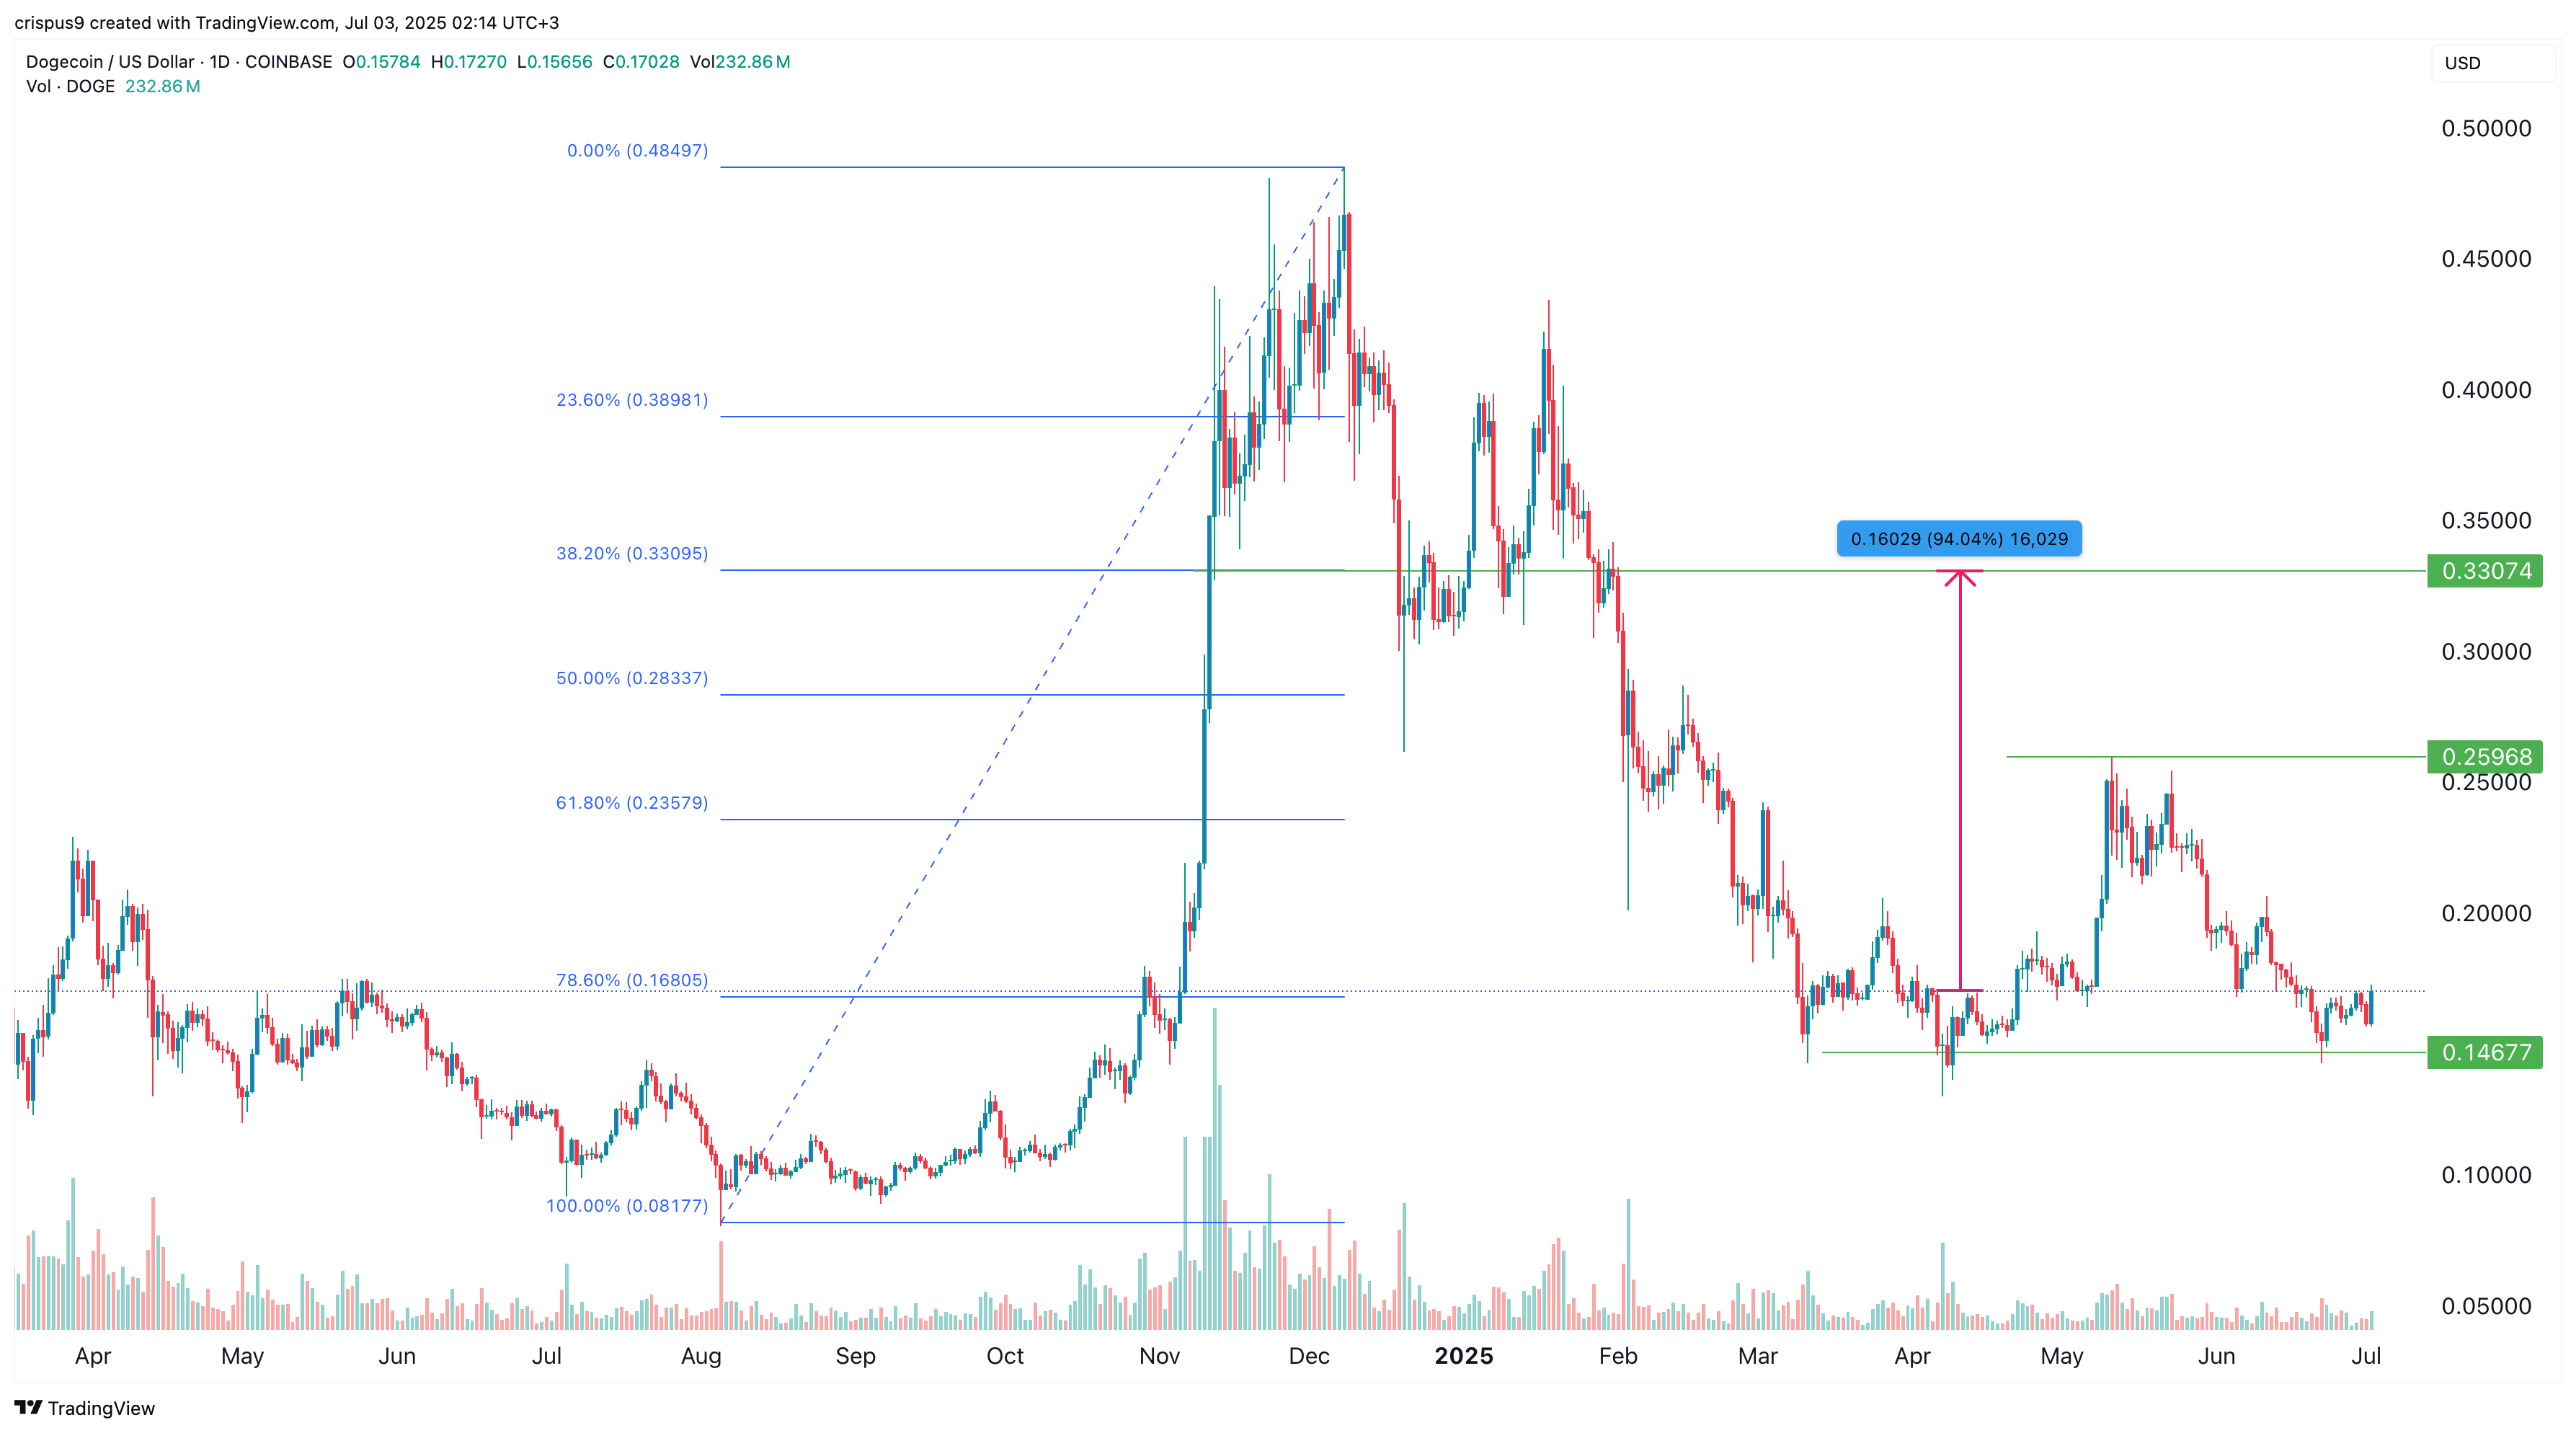
Technical analysis is an effective approach for predicting the next price targets for cryptocurrencies and other assets. In this case, Dogecoin price has formed a giant double-bottom pattern at $0.1467 and a neckline at $0.2596.
A double bottom is one of the most bullish chart patterns in technical analysis. It typically implies that short sellers are hesitant to place sell orders below the lower limit.
In this case, the double-bottom level coincided with the 78.2% Fibonacci Retracement level. It has also happened at a time when the volume has retreated, which is a notable characteristic of the pattern.
Therefore, the coin is likely to experience a bullish breakout in the coming weeks, with the next key level to watch being $0.2596, the neckline of the double bottom. A move above that level will indicate further upside, potentially to the 38.2% Fibonacci Retracement level at $0.3300, which is approximately 95% above the current level.
The bullish DOGE price forecast will become invalid if it drops below the double-bottom point at $0.1467. Such a move will point to further downside, potentially to last year’s low of $0.0817.
The Bullish Case for DOGE Price
The primary reason the Dogecoin price is poised to surge is that conditions are ripe for a crypto market bull run. For example, the Federal Reserve is about to start cutting interest rates later this year, a move that will make riskier assets more attractive.
Furthermore, there are indications that the Bitcoin price is poised to surge, which will likely draw investors to other altcoins, such as Dogecoin and Shiba Inu.
Internally, Dogecoin is attractive because it has become highly undervalued, with the MVRV z score moving to 0.241, down from last month’s high of 1.24. A falling MVRV indicator is a sign that a cryptocurrency is highly undervalued, making it an ideal investment for contrarian investors.
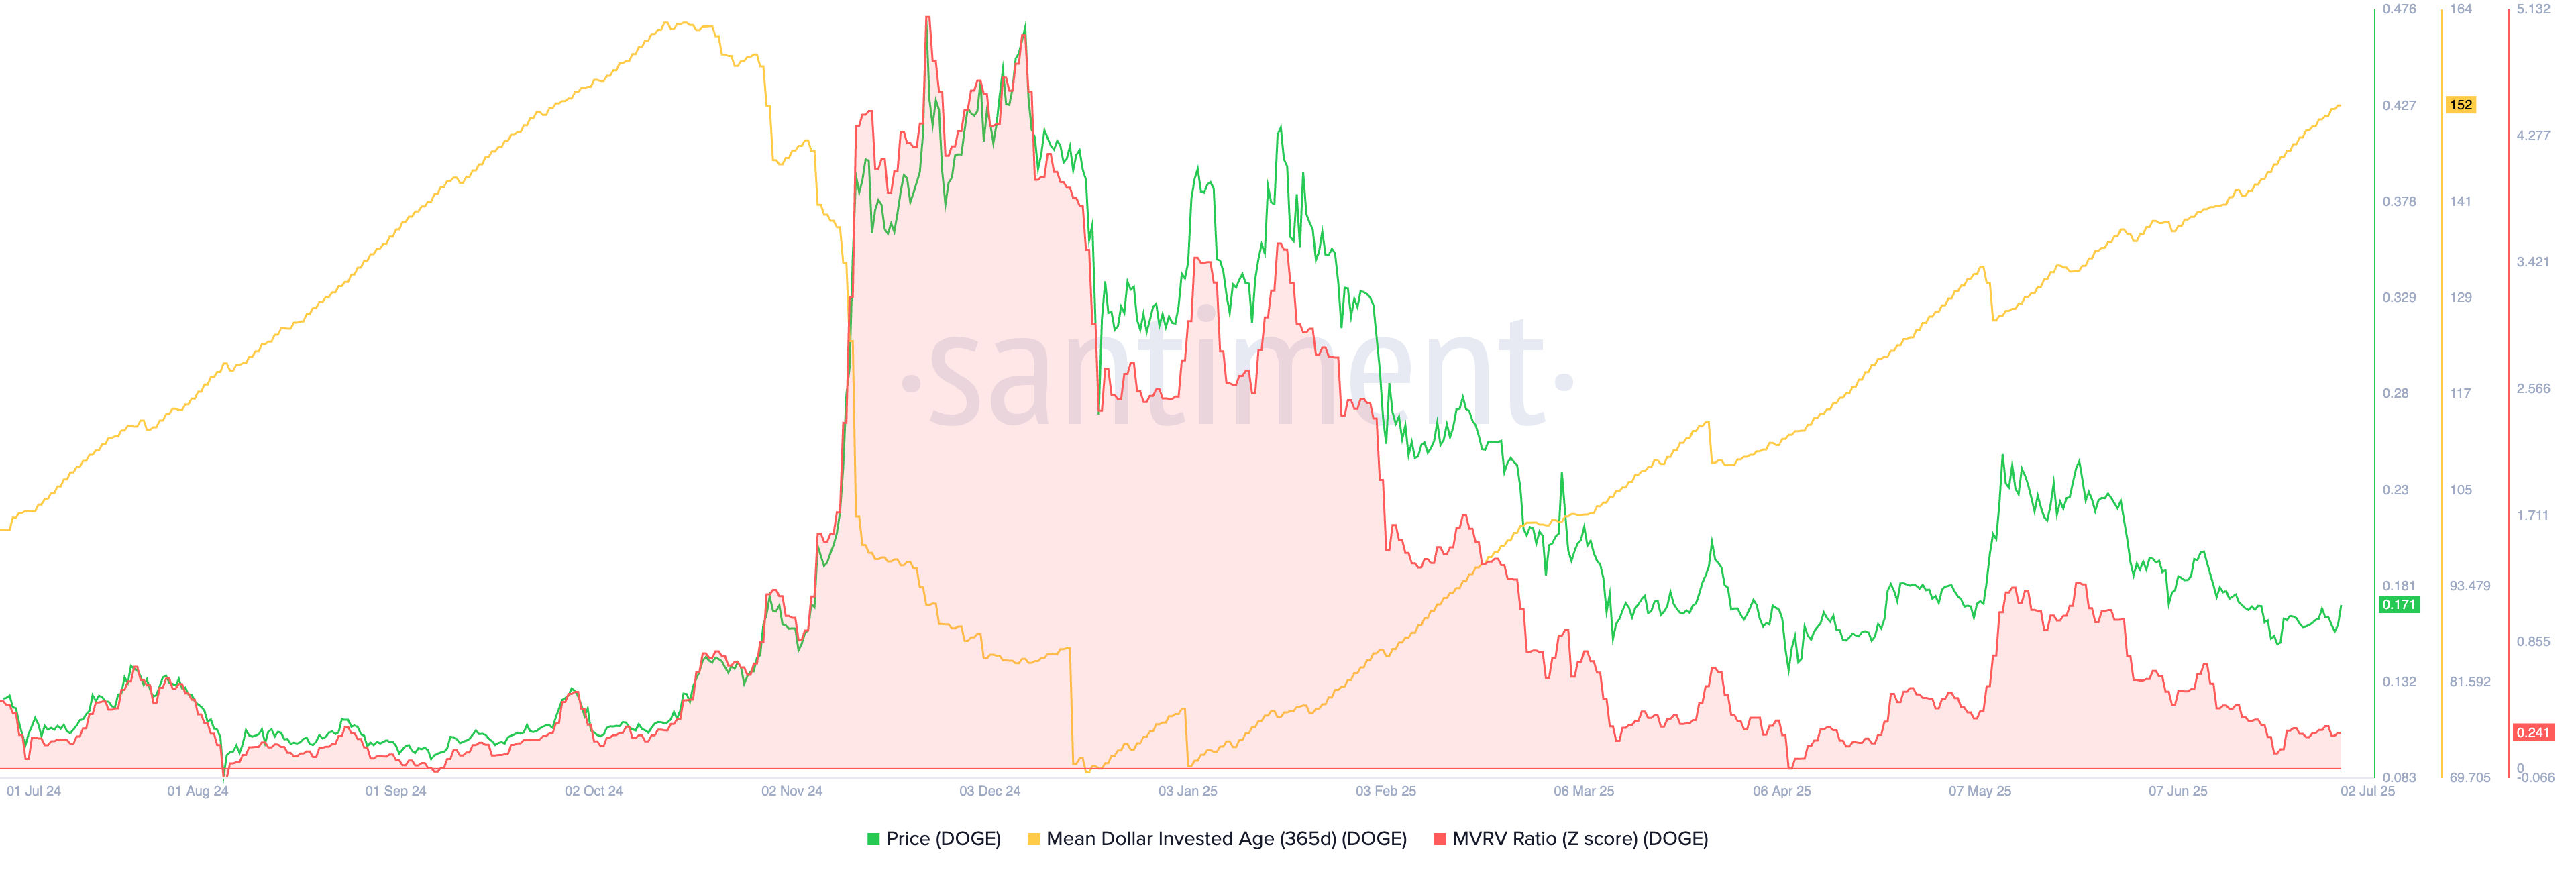
As the chart above shows, the 365-day Mean Dollar Invested Age (MDIA) indicator has surged to 152, much higher than the year-to-date low of 71. This is a sign that investors are holding their tokens for longer, which is a good sign.
READ MORE: XRP Price Prediction: Technical Analysis Points to a Surge