


HBAR price surged to a multi-month high as Hedera Hashgraph’s open interest jumped, following some highly bullish ecosystem news. The token jumped for seven consecutive days, reaching its highest swing since March 7. It has soared by over 93% from its lowest point in June.
Hedera Hashgraph News
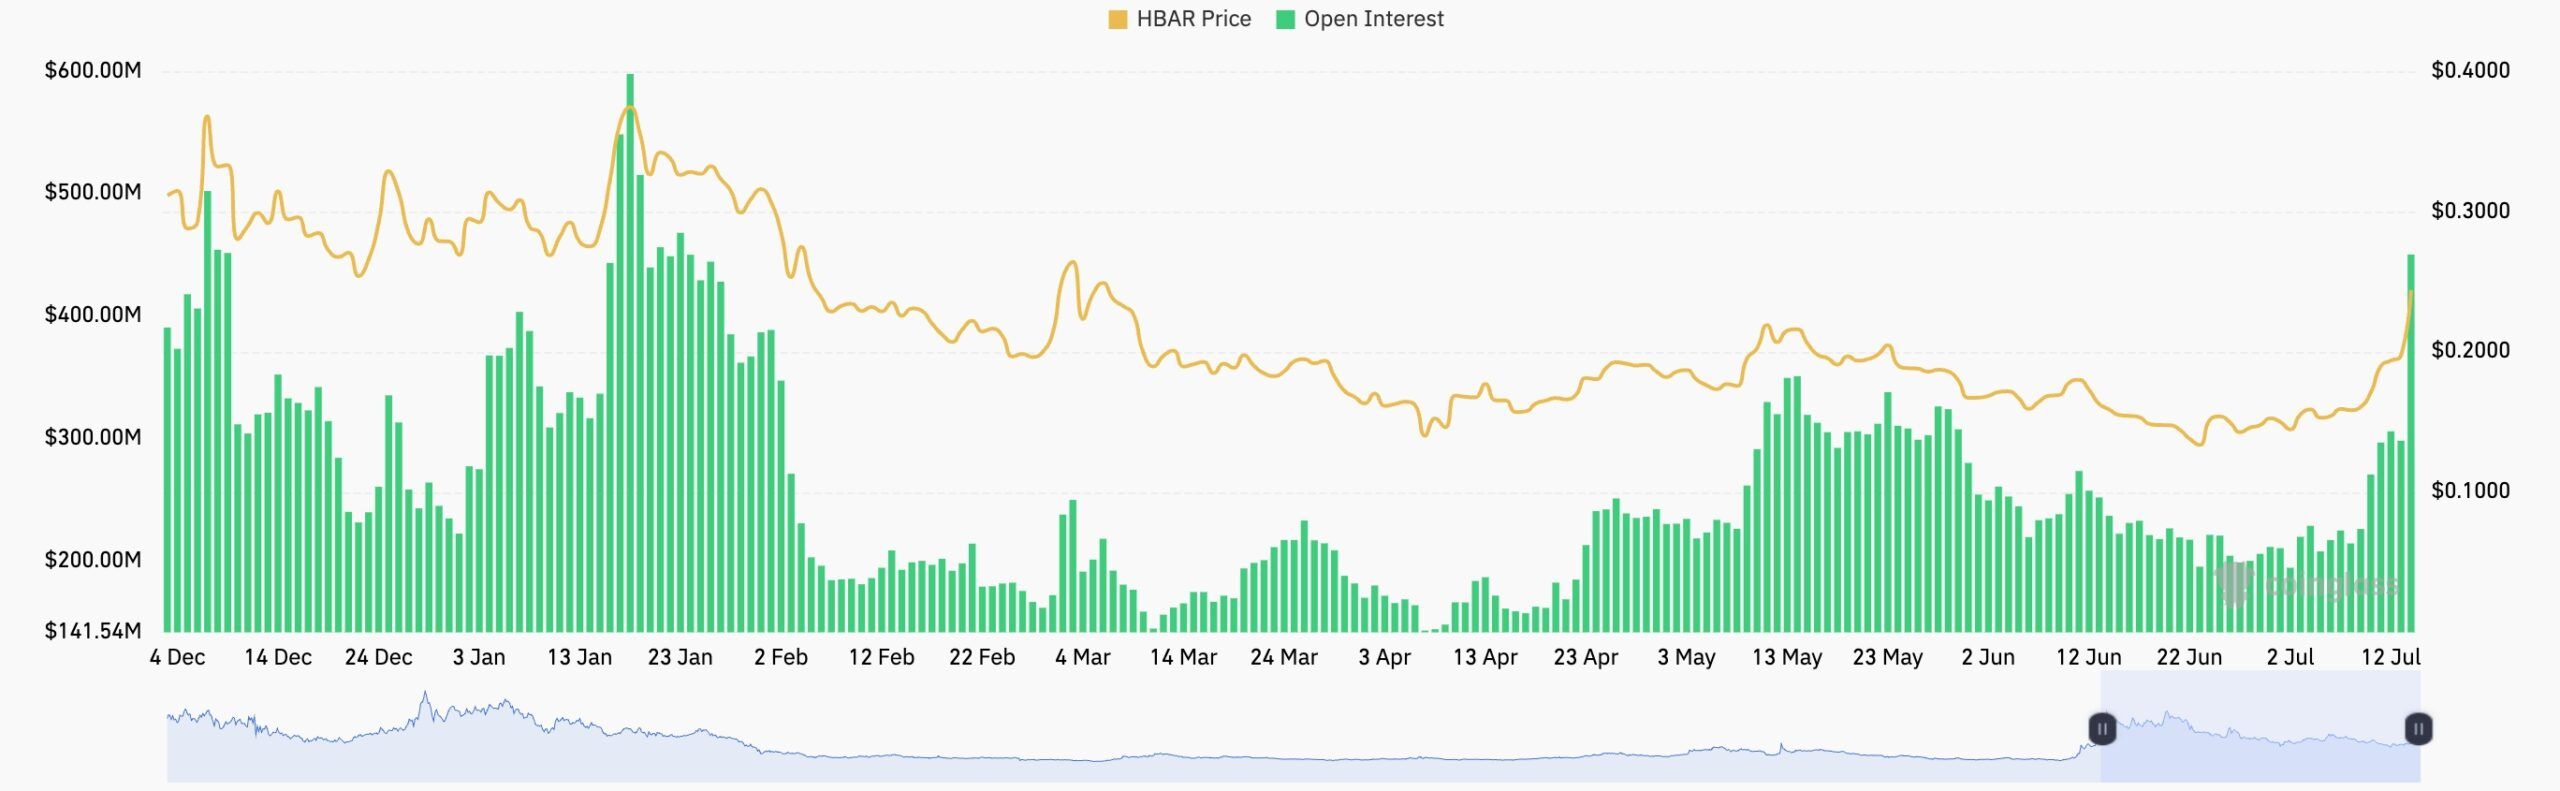
The HBAR price has surged in the past few days after third-party data showed that the futures open interest reached $450 million, the highest point since January 23rd. It has been in a strong uptrend after bottoming at $195 million in June.
A surging futures open interest is a highly bullish aspect because it is a sign that investors are piling into it. It has coincided with a surge in daily volume, with the 24-hour figure reaching over $1.43 billion.
Meanwhile, there are signs that Hedera’s network is doing well. For example, AP+, a member of Hedera’s governing council, was selected to participate in a project known as Acacia.
Acacia is a collaboration between the Reserve Bank of Australia (RBA) and the Digital Finance Cooperative Research Centre. The project explores the concept of Real-World Asset (RWA) tokenization, which the RBA estimates could lead to $13 billion in savings in the capital markets.
Another notable Hedera news item is that SALT, a popular South Korean trading application, has integrated with Hedera. This integration will help to improve MemeFi trading on Hedera.
Further, HBAR price has jumped as the total USDC supply on the network surged. Data show that the supply jumped to over $151 million, a 20% increase in the last seven days. It has soared from the year-to-date low of $42 million.
Moreover, the total value locked (TVL) in the decentralized exchange (DEX) network has jumped by over 25% in the last 24 hours to over $257 million. It has soared from a low of $78 million in November last year.
READ MORE: Cardano Price Prediction: Whales Buy Ahead of NIGHT Airdrop
HBAR Price Technical Analysis
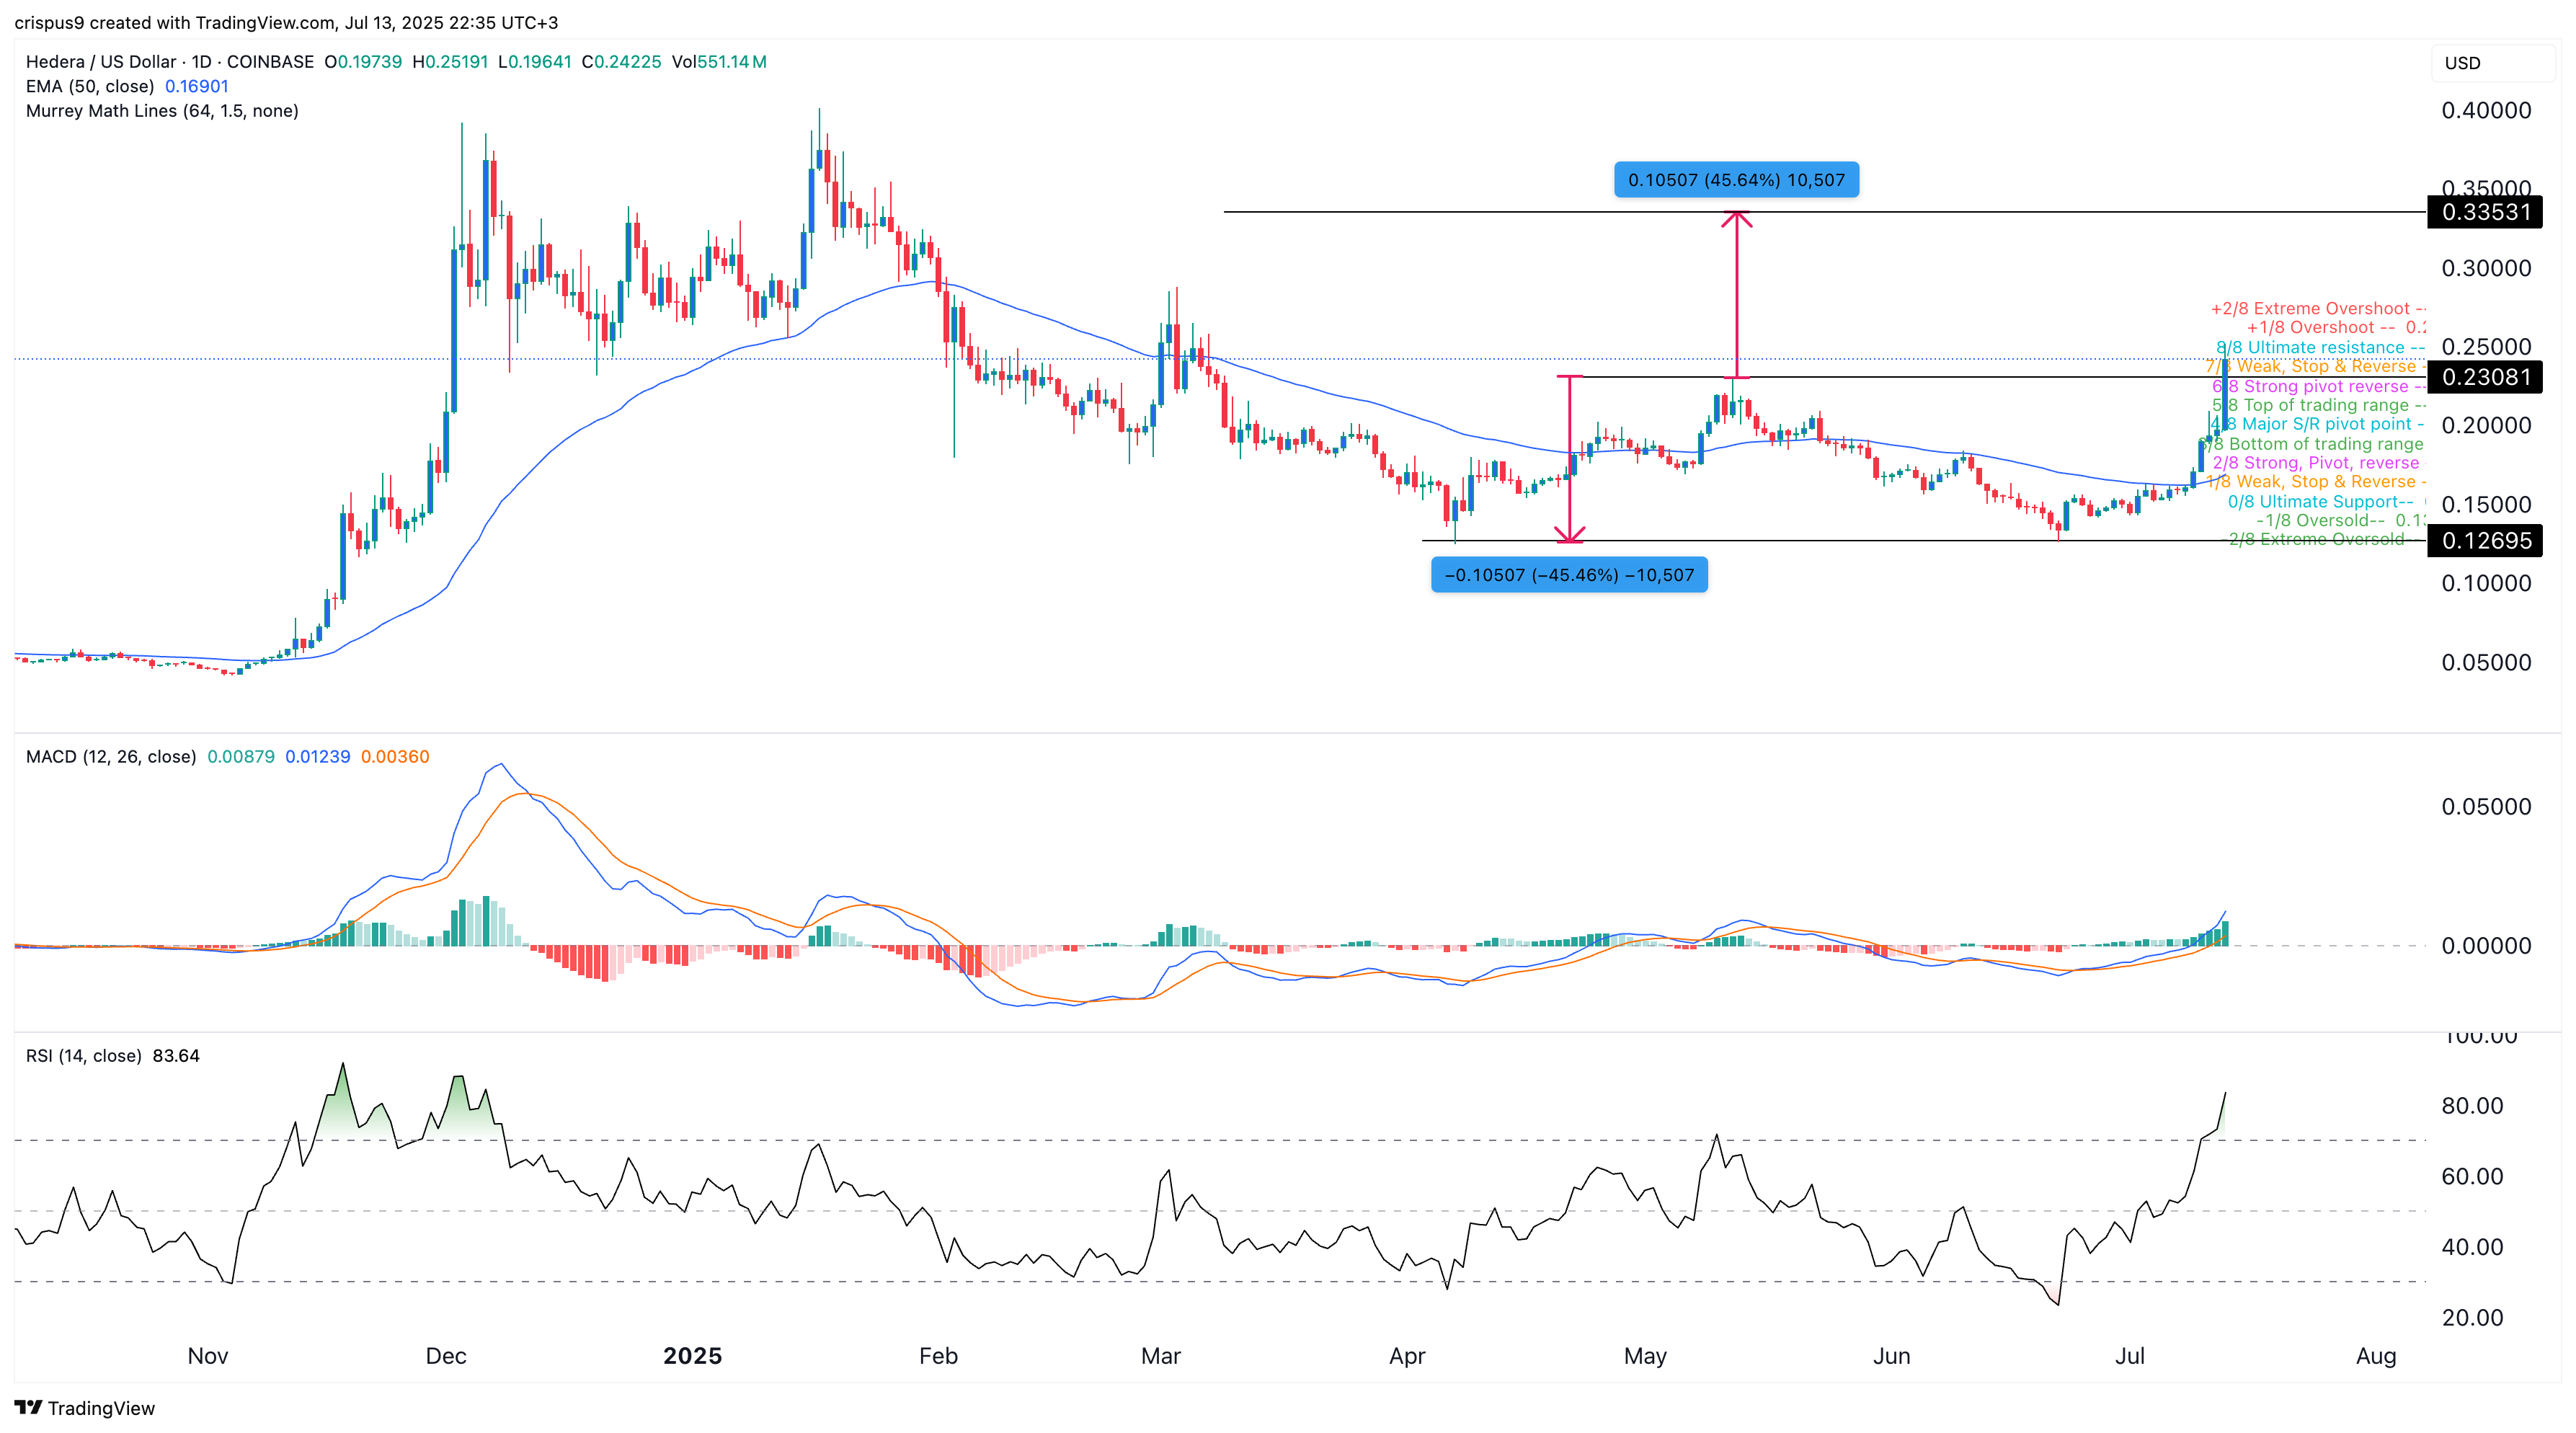
The daily chart shows that the Hedera price formed a double-bottom pattern at $0.1270, its lowest level in June and April this year. It has moved above the neckline at $0.2300, its highest point in May.
The HBAR price has moved above the 50-day and 100-day Exponential Moving Averages (EMAs) and the weak, stop-and-reverse point of the Murrey Math Lines.
The Average Directional Index (ADX), the Relative Strength Index (RSI), and the MACD have all pointed upwards.
Therefore, the path of least resistance for the HBAR price is bullish, with the next target being at $0.335. This target is based on the height of the double-bottom pattern, which is then measured from the neckline.
READ MORE: XLM Price Prediction: Here’s Why Stellar Token Could Surge Soon