


Stellar Lumens (XLM) and Ripple (XRP) were notable laggards during the ongoing crypto bull run. XRP price was trading at $3.26 on Wednesday, a range it has remained in the past few days, while XLM was stuck at $0.45.
The two tokens lagged behind the market as Bitcoin and Ethereum neared their all-time high, and the total market capitalization of all coins jumped to over $4.10 trillion. This article conducts a technical analysis to determine whether the market will rebound or crash.
XRP Price Technical Analysis
A closer look at the XRP price shows that the coin is on the cusp of a strong bullish breakout in the coming months. The bullish outlook is based on the fact that it has remained above the 50-day moving average, which has provided it with substantial support.
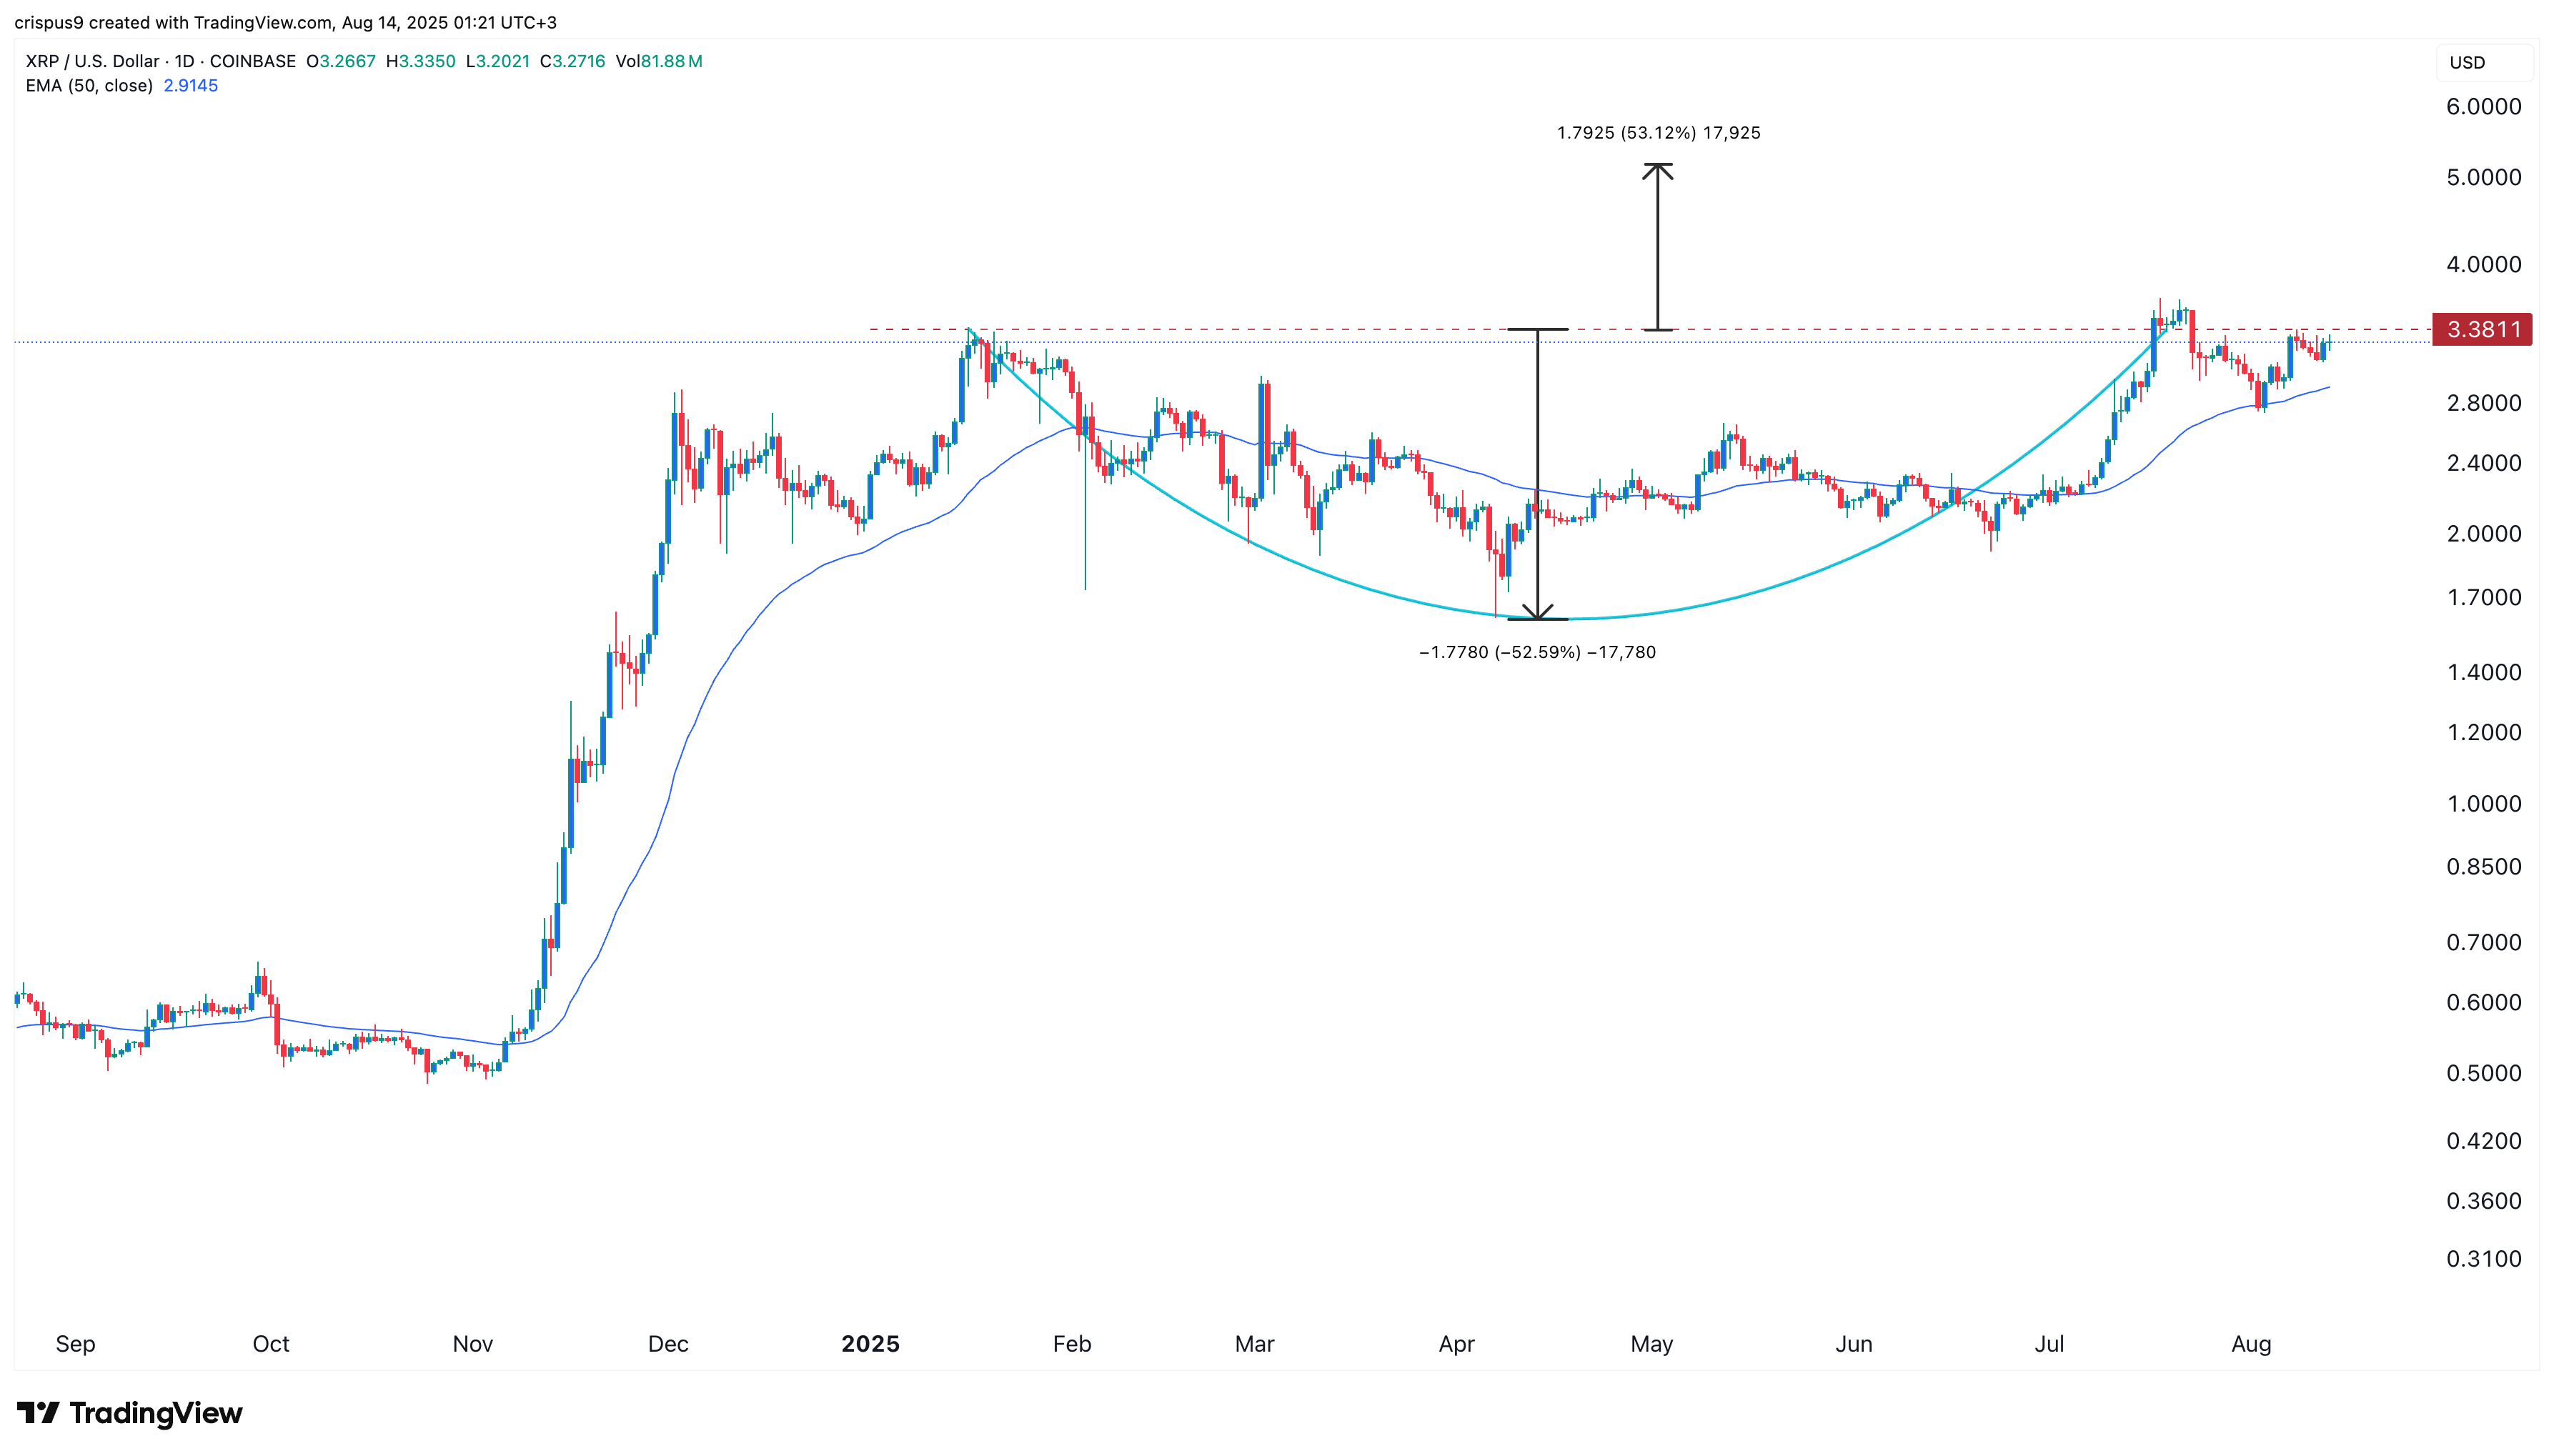
The Ripple token has formed a cup-and-handle pattern, one of the most common continuation signs. This pattern has a horizontal resistance, which, in this case, is at $3.3811, its highest level in November last year and July.
The pattern also has a rounded bottom, which forms the cup section. The distance between the resistance and the cup’s upper and lower sides is 51%. XRP is now in the handle section.
Therefore, this technical analysis points to an eventual comeback in the coming days once the handle section is completed. If this happens, the next point to watch will be the psychological point at $4. Moving above $4 will see the token soar to $5.2, the C&H target.
READ MORE: Pepe Price Alert: At Risk as Whales Buy 440B Coins and ETH Surges
XLM Price Technical Analysis
Stellar price has also moved sideways this week. However, a closer look shows that the token may be on the cusp of a strong bullish breakout.
The daily chart shows that it has remained above the 50-day moving average. It has also moved above the upper side of the falling wedge pattern that formed between July 16 and August 4. A wedge is one of the most common reversal signs.
Additionally, XLM price has formed a bullish pennant pattern, comprising a vertical line and a triangle. It has also moved to the top of the trading range of the Murrey Math Lines indicator.
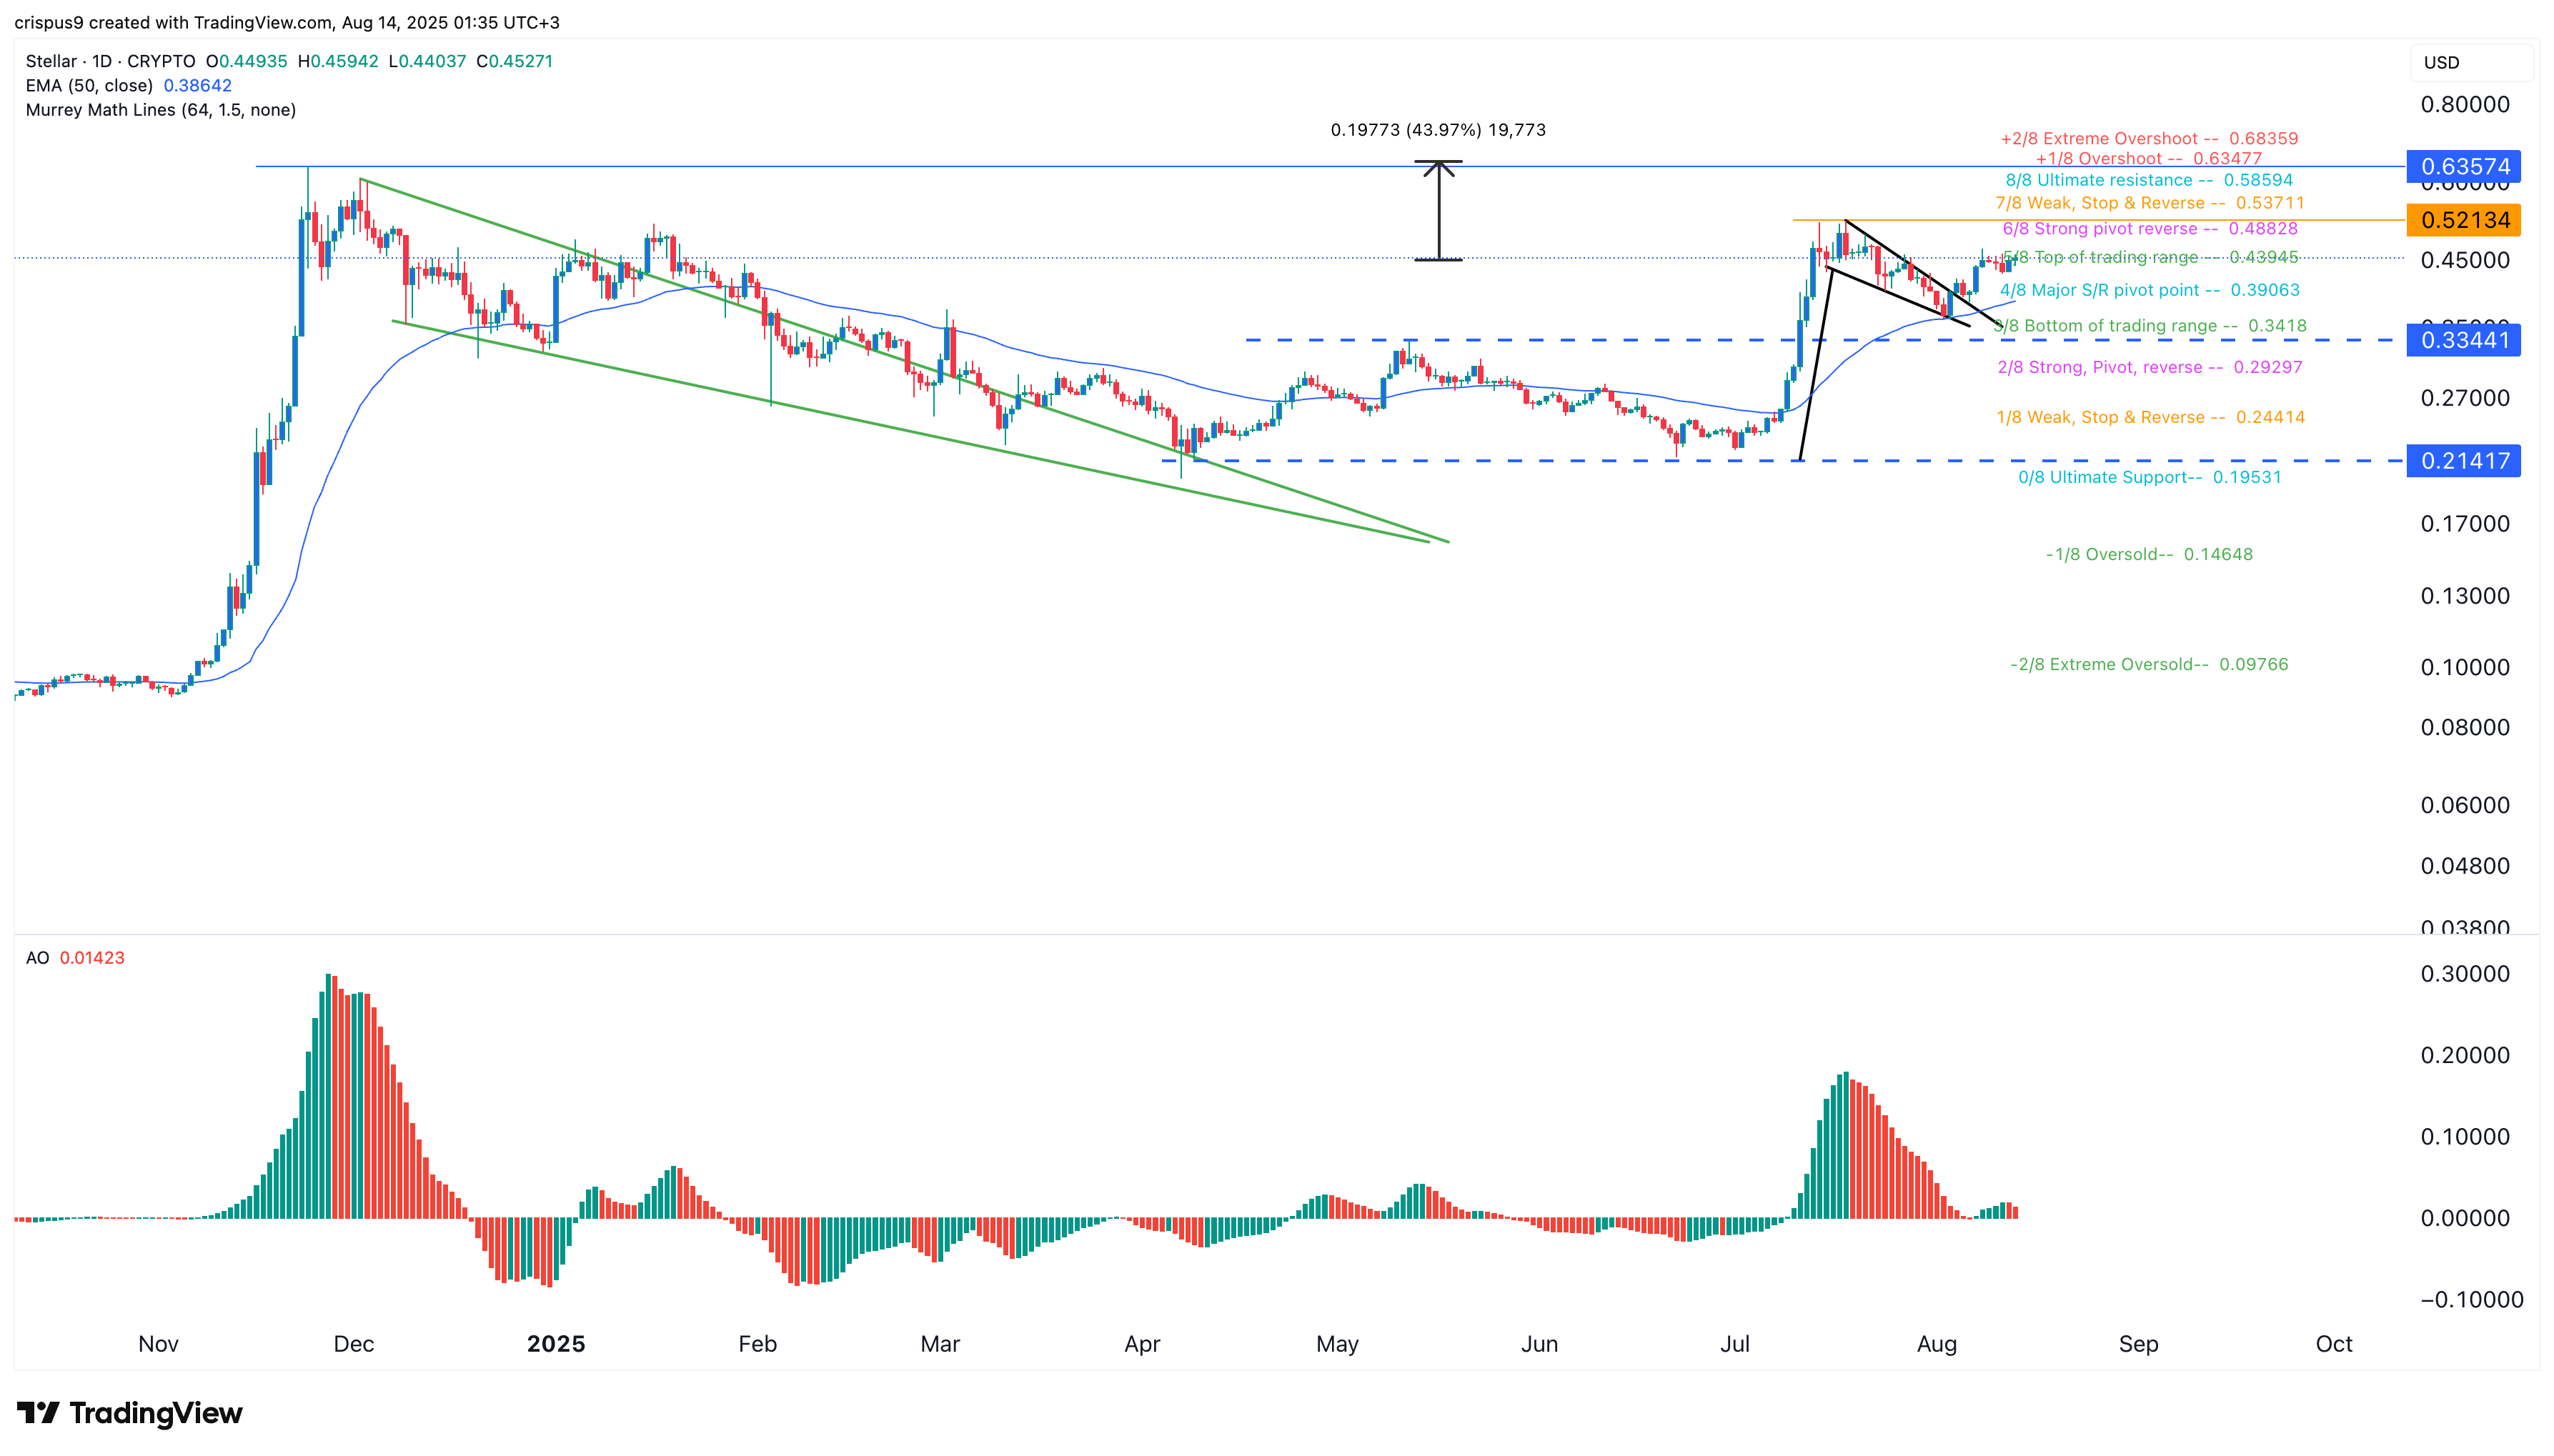
The Awesome Oscillator is also above the zero line. All these patterns point to an eventual rebound, with the initial target being at $0.6357, its highest point in November, which is about 43% above the current level.
READ MORE: Altcoin Season: Why are Crypto Like Chainlink, Polkadot, Cardano Prices Going Up?