


The crypto market was highly volatile last week as the Bitcoin price surged to a record high and then pulled back. Most altcoins rallied and then pared back their initial gains, with the market capitalization of all tokens ending the week at $4.02 trillion.
This article explores the top cryptocurrencies to watch this week, including Pi Network (PI), Bonk (BONK), and Arbitrum (ARB).
Will the Pi Network Price Rebound?
Pi Network will be one of the top cryptocurrencies to watch this week as investors focus on its technicals. The daily timeframe chart shows that the token has formed a falling wedge chart pattern, which comprises two descending and converging trendlines.
The wedge is one of the most common reversal patterns in technical analysis. Now, with the two lines nearing their convergence, there is a likelihood that the Pi crypto token will soon have a strong bullish breakout.
The bullish outlook is also seen by the fact that the two lines of the Percentage Price Oscillator (PPO) have formed a bullish crossover pattern. Also, the BBTrend oscillator, which looks at the spread of the Bollinger Bands, has formed a bullish divergence pattern.
Therefore, the Pi Coin price may stage a strong bullish breakout in the coming weeks. If this happens, the next price to watch will be the psychological point at $1.
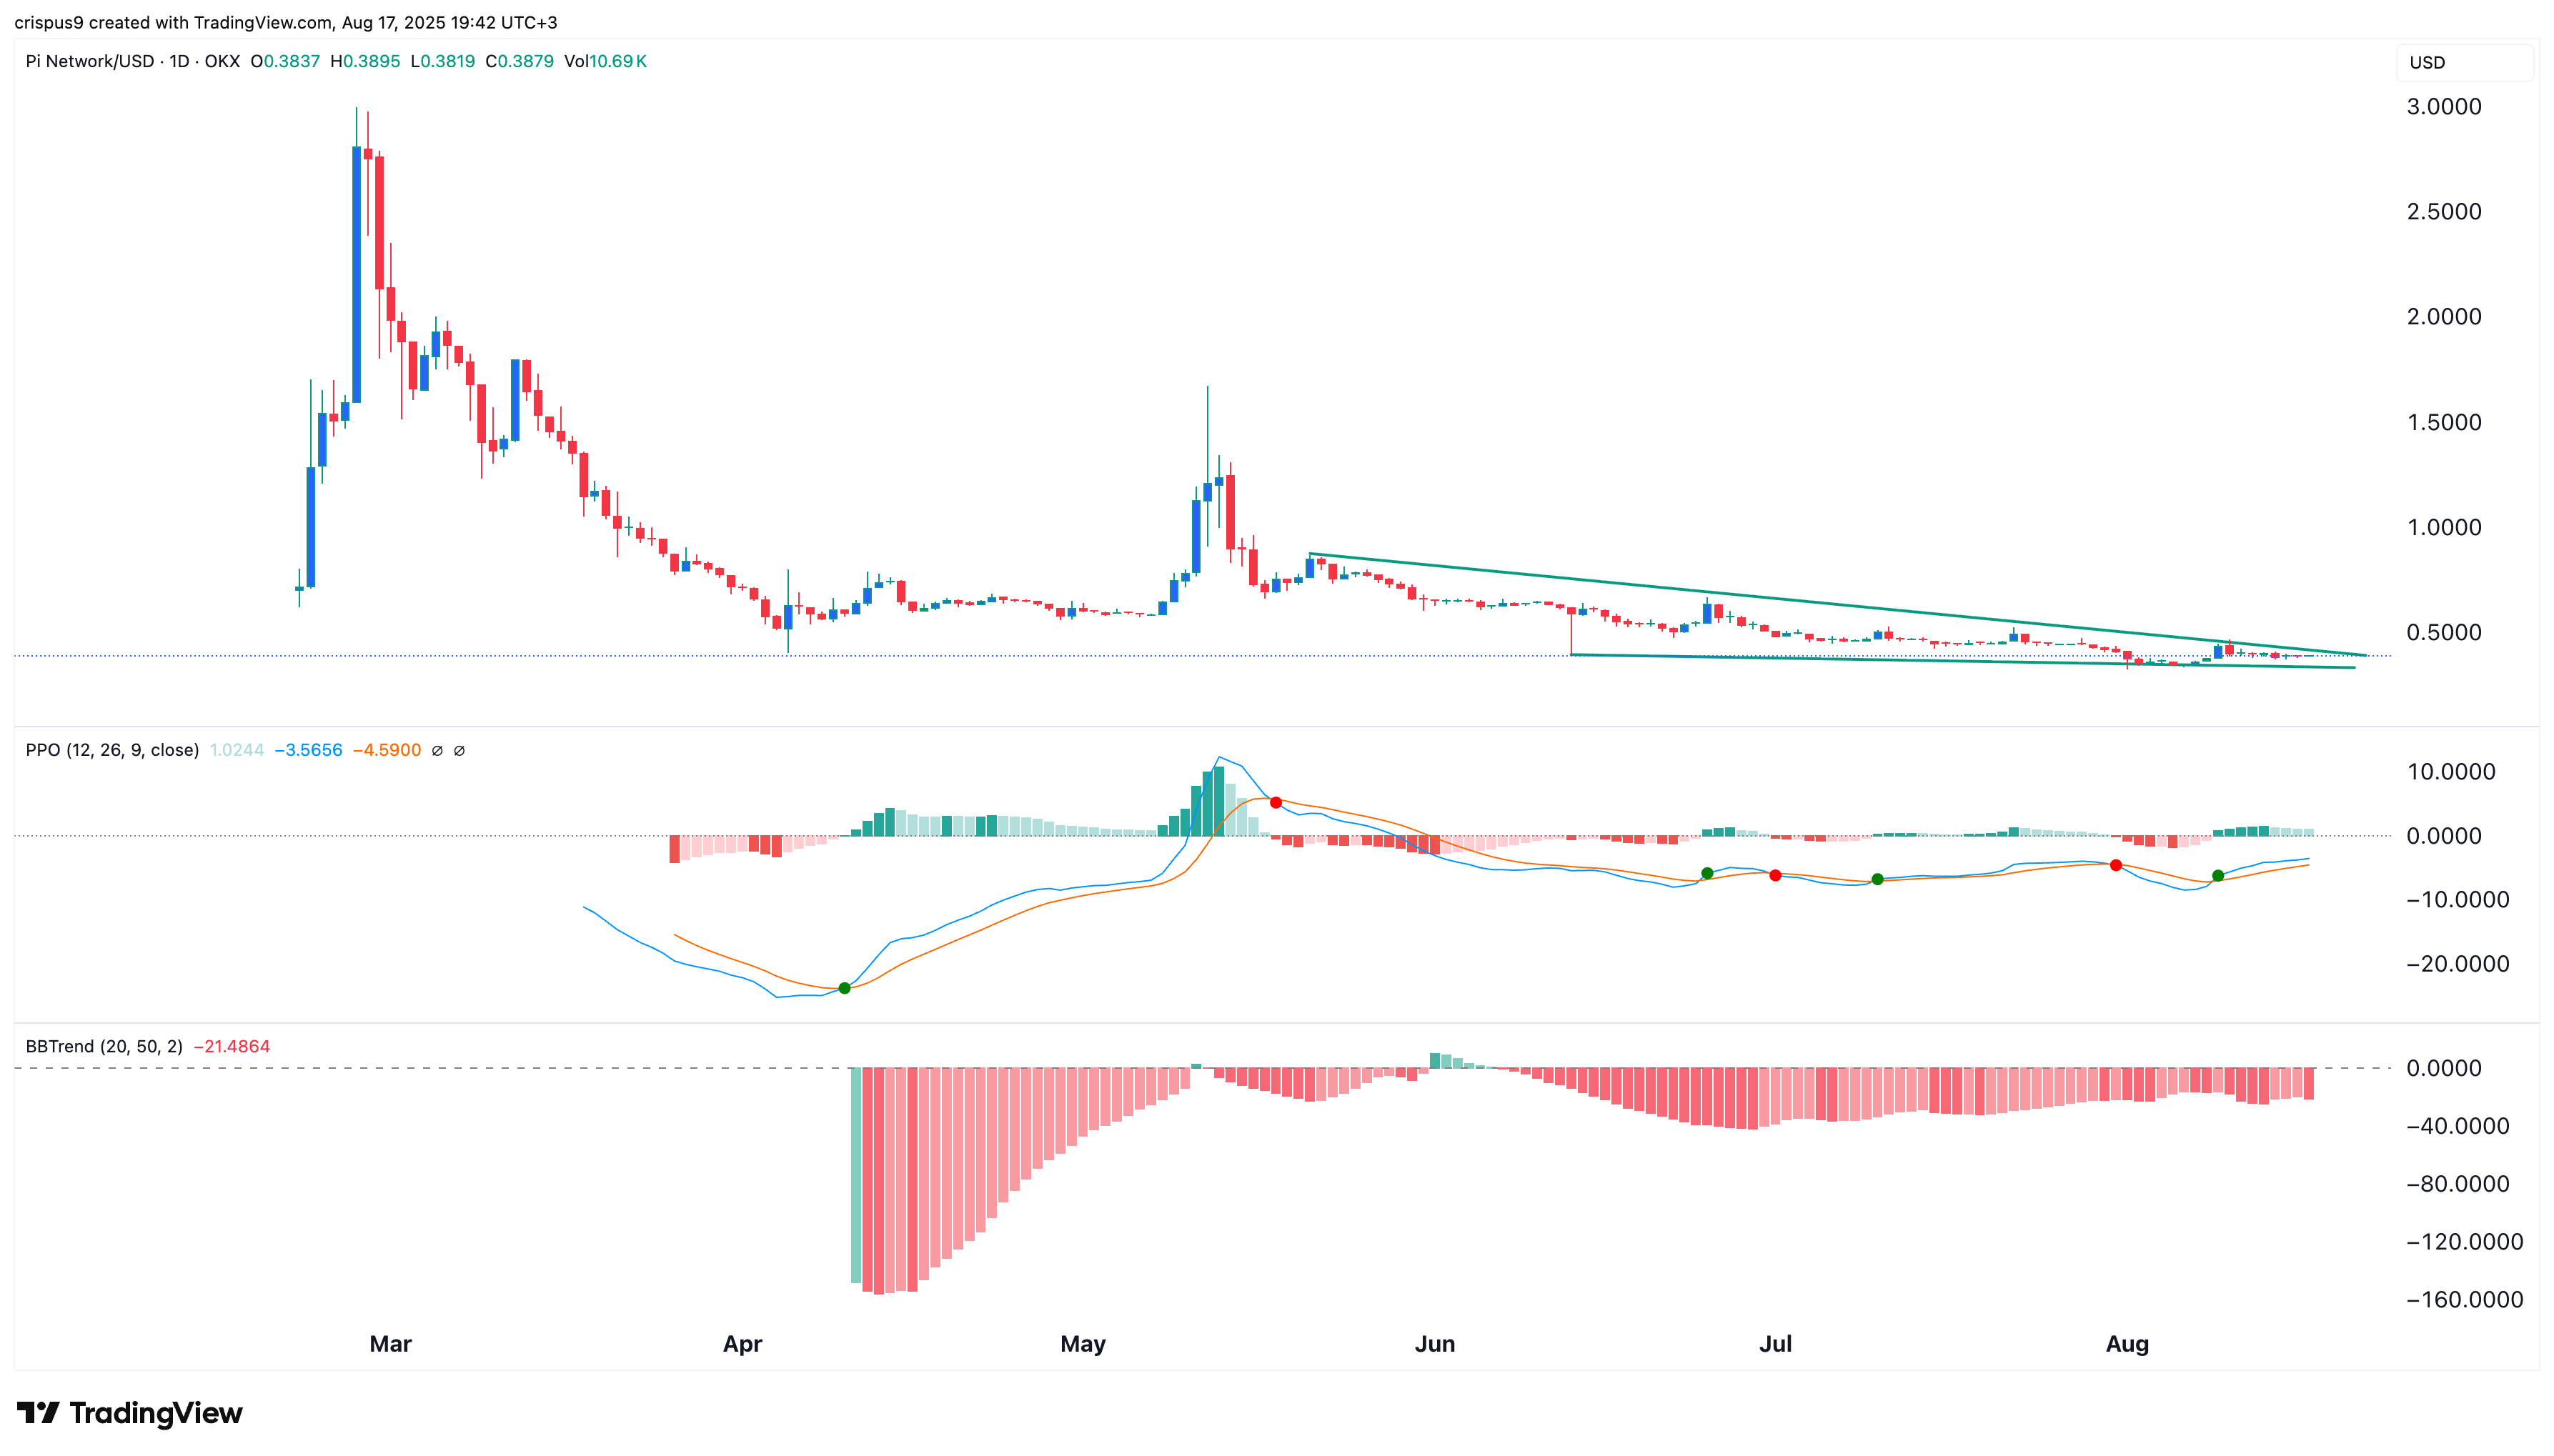
Pi Network price chart
READ MORE: The Contrarian Case for Pi Network Coin as Price Crashes
Bonk (BONK)
Bonk is another top cryptocurrency to watch this week as it forms two distinct chart patterns. On the positive side, the token has formed the highly bullish megaphone pattern, also known as a broadening wedge. This pattern has two diverging trendlines and often stages a strong comeback.
However, this pattern is happening after the token crashed, meaning that it could be a bearish flag, which often leads to more downside. If this happens, the token will likely be at risk of plummeting to the support at $0.00001147, its lowest swing in June and 52% below the current level.
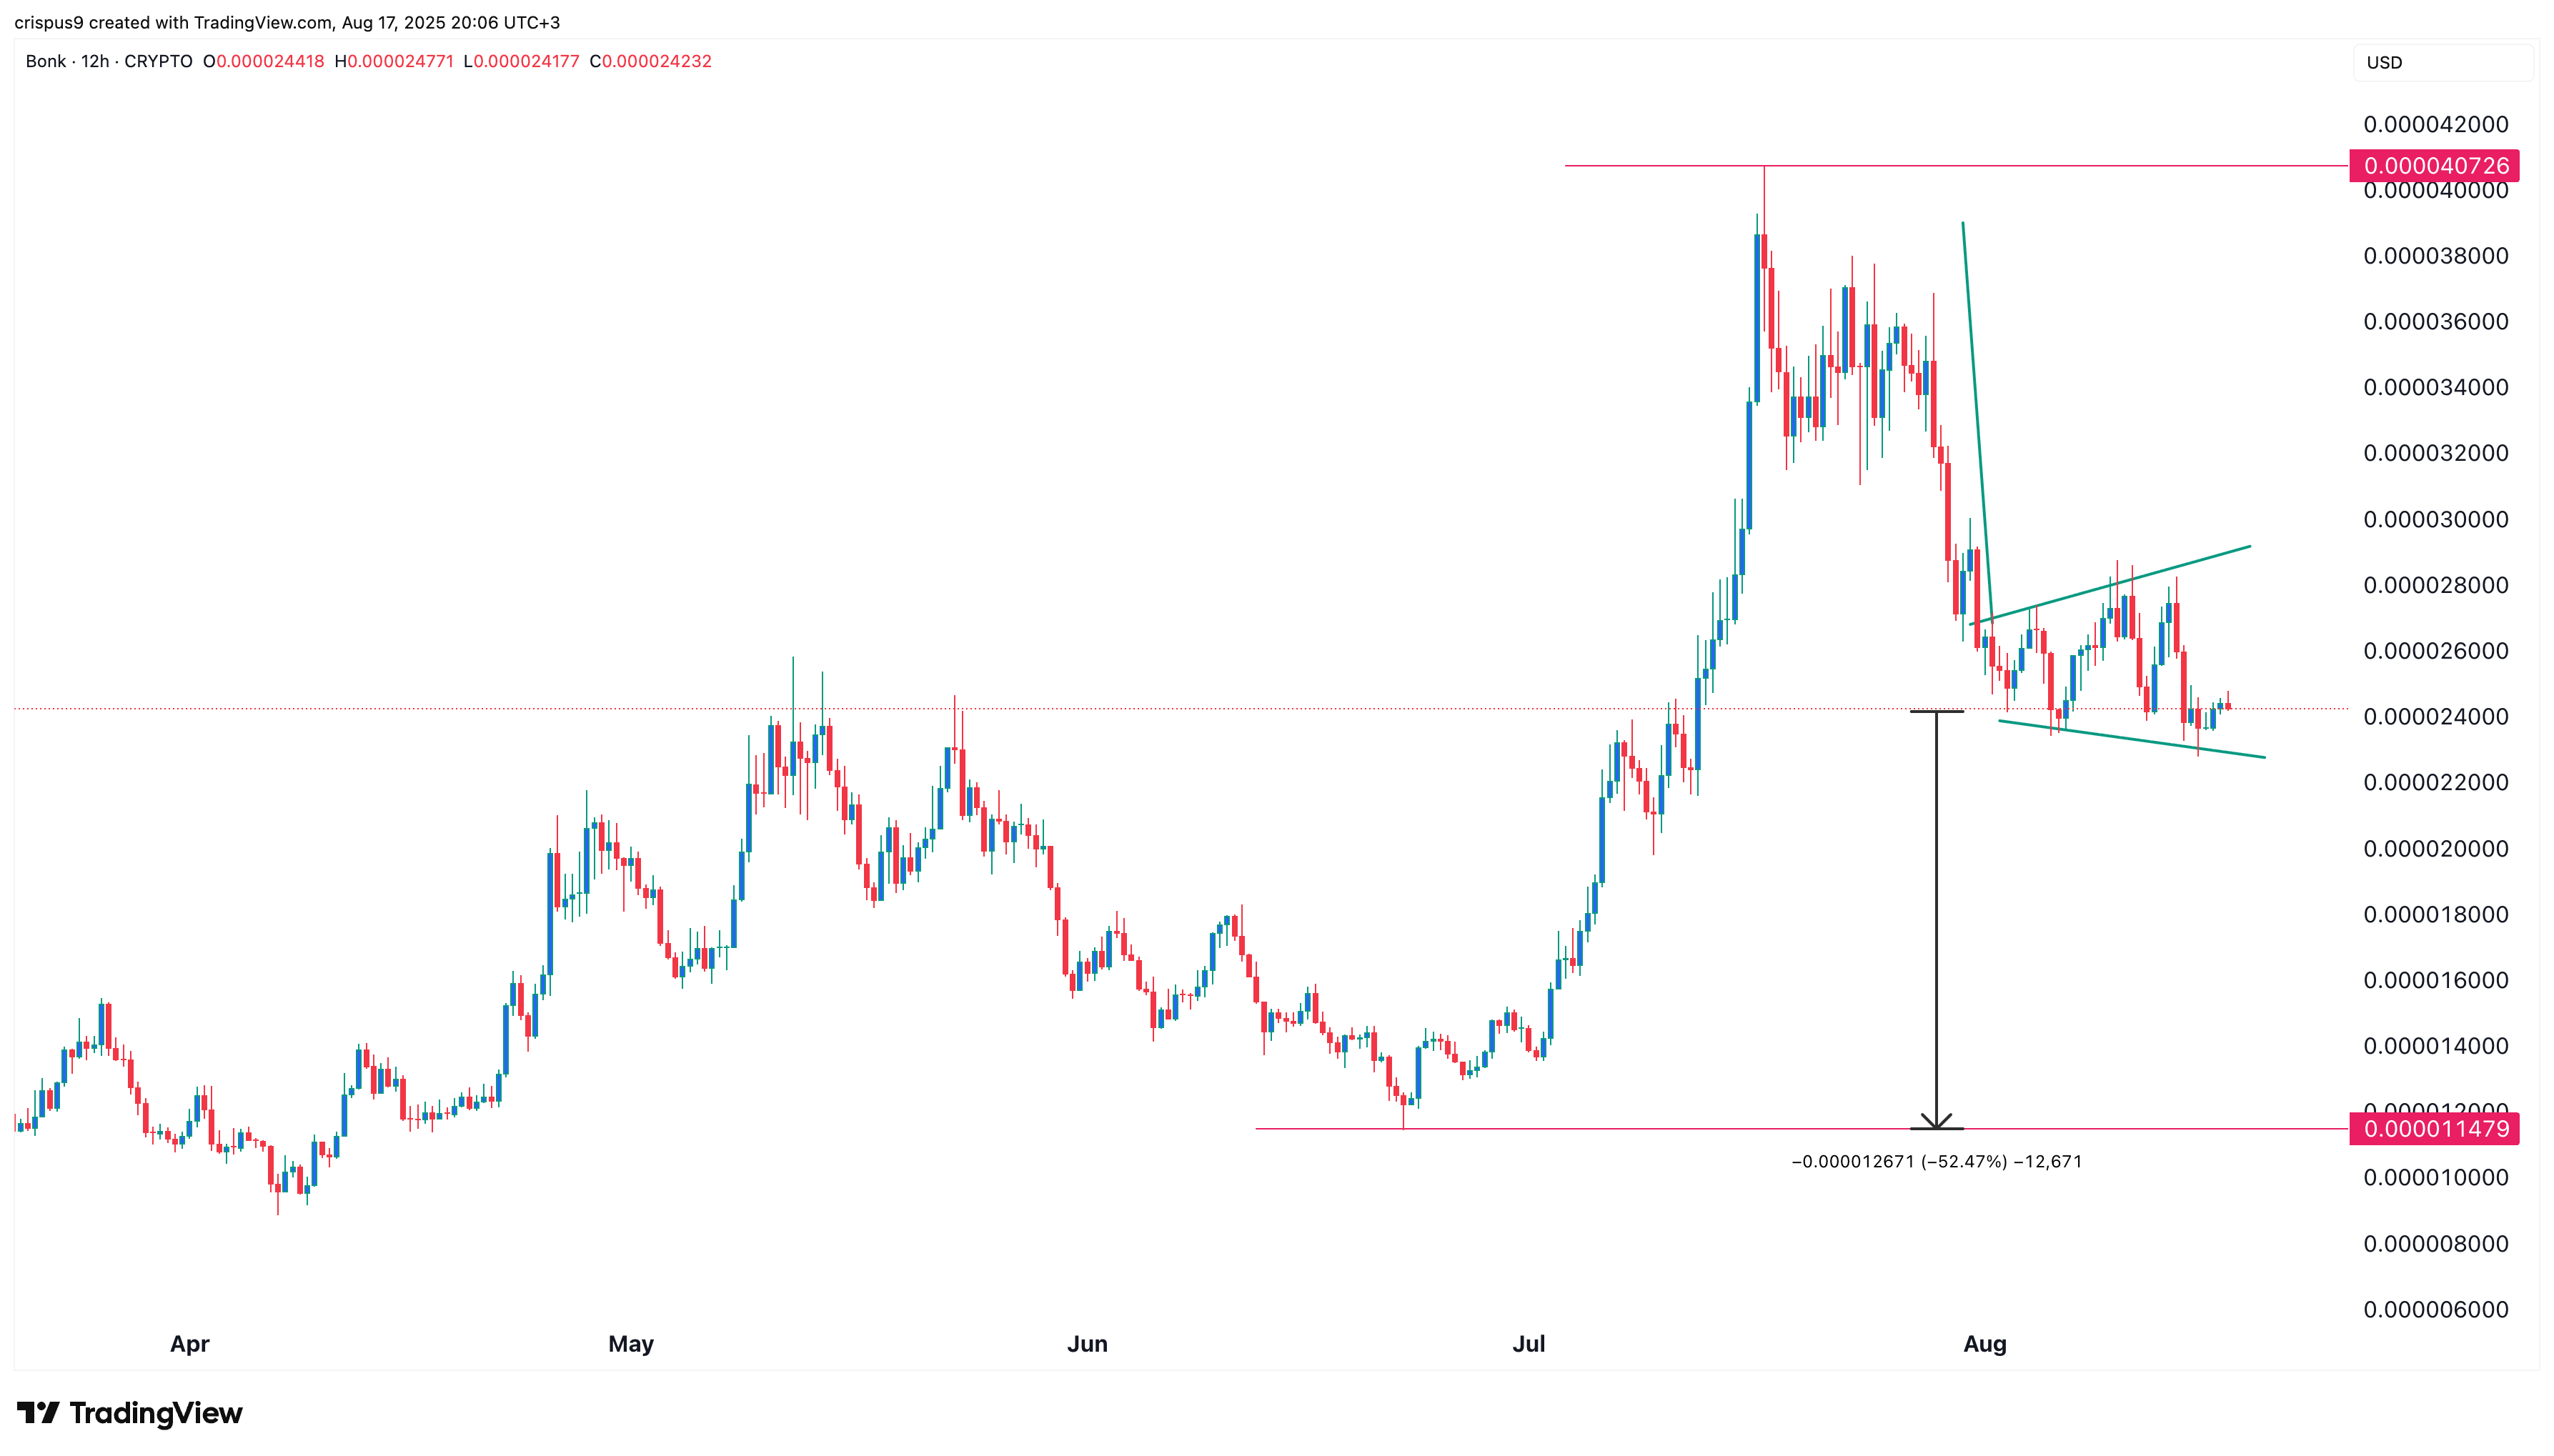
Bonk price chart
Arbitrum Price Nears Golden Cross
Arbitrum token price will be one of the top cryptocurrency prices to watch this week due to its technical indicators. The daily chart shows that the spread between the 50-day and 200-day Exponential Moving Averages (EMA) has continued to narrow this year.
These two averages are at $0.4275 and $0.4430, respectively, meaning that the crossover will likely happen soon. If this happens, the next point to watch will be at $0.7392, the 50% Fibonacci Retracement level, which is 35% above the current level.
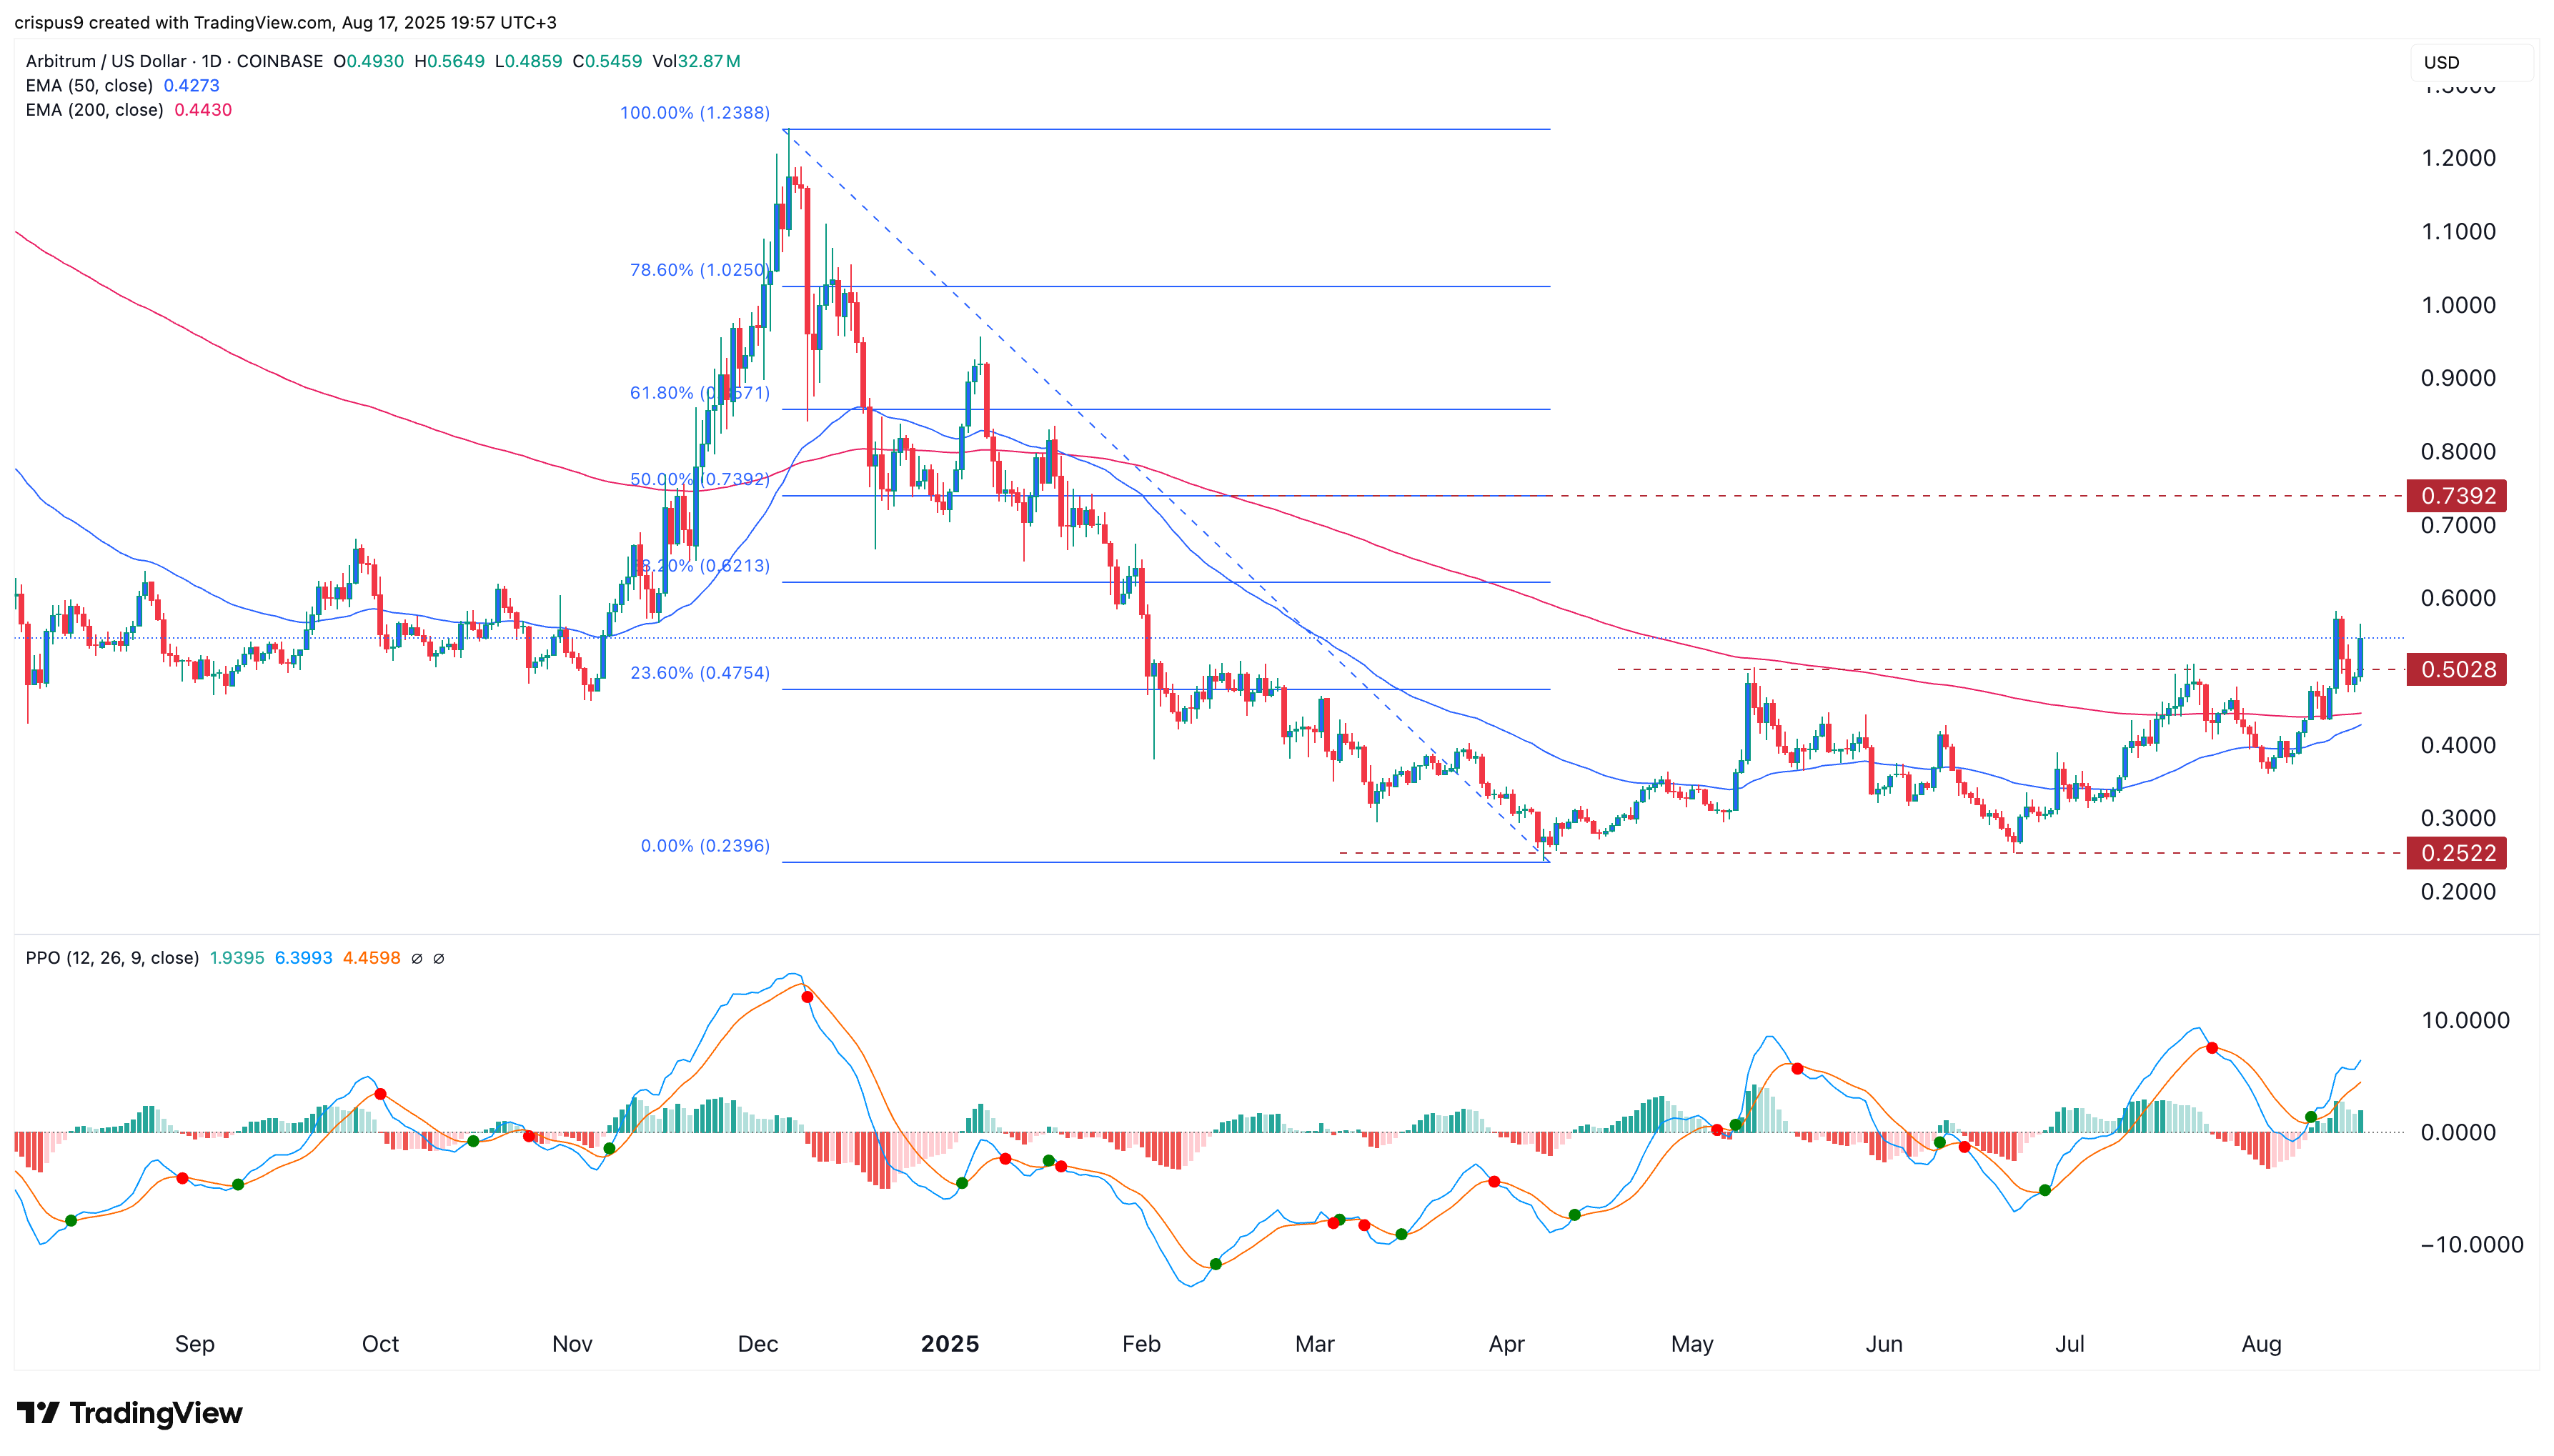
ARB price chart | Source: TradingView
Arbitrum’s platform is doing well, with the stablecoin supply soaring by 10% to $8.7 billion in the last 30 days. More data shows that the total volume in decentralized exchanges in its ecosystem jumped to $5.7 billion last week, with Uniswap and PancakeSwap leading the way. It was the highest figure since May.
READ MORE: VVV Price Analysis: Here’s Why the Venice Token May Pump