

BNB price surged to a fresh all-time high of $899 on August 22, igniting speculation across trading desks that the token could be the next major crypto to cross the $1,000 threshold soon.
The move capped a 6.8% daily rally that lifted Binance Coin’s market cap to $124.7 billion, the fifth-largest cryptocurrency.
With momentum increasing, traders are now asking: Can BNB price finally surpass the $1,000 mark after reaching $899.66, nearly $900, as we predicted earlier?
Institutional Flows and Ecosystem Tailwinds
Catalysts for the breakout extend well beyond technical levels. As we recently reported, Nasdaq-listed BNB Network Company (BNC) disclosed a $160 million purchase of 200,000 BNB, instantly becoming the largest corporate holder of the token.
BNC also hinted at plans to scale toward 325,000 BNB, mirroring MicroStrategy’s now-famous Bitcoin treasury play. Corporate holdings now represent 0.14% of circulating supply, creating structural demand that offsets retail profit-taking.
Moreover, this wave of corporate adoption is not isolated. Nano Labs ($90M) and Windtree Therapeutics ($60M) have also allocated capital into BNB treasuries, despite Windtree’s stock tumbling 77% after its pivot.
On-chain data support the bullish case. BNB Chain processed 115 million transactions this week, up 12% month-on-month, while maintaining its ultra-low fee structure ($0.016 average).

BNB leads in terms of active addresses | Token Terminal
Token Terminal ranks BNB Chain as the #1 blockchain by weekly active addresses at 16.6M users, ahead of NEAR (16.1M) and Solana (13.8M). Daily active wallets also show strength, with 2.3M active addresses on August 21, according to BscScan.
Meanwhile, Binance’s HODLer Airdrops program is driving fresh staking demand. The latest Plume (PLUME) token airdrop distributed 150M tokens to BNB stakers, reinforcing staking lock-ups as a liquidity sink. Similar campaigns in past cycles have preceded strong spot price inflows.
BNB Price Prediction: Bulls Eye $923, Then $1,000
The BNB token is currently trading above all key moving averages. The 30-day moving average is at $847.8, the 50-day is at $845.2, and the 200-day is at $802.8. Short-term trendlines are also showing a positive trend, with the 7-day moving average at $865, which is below the current price.
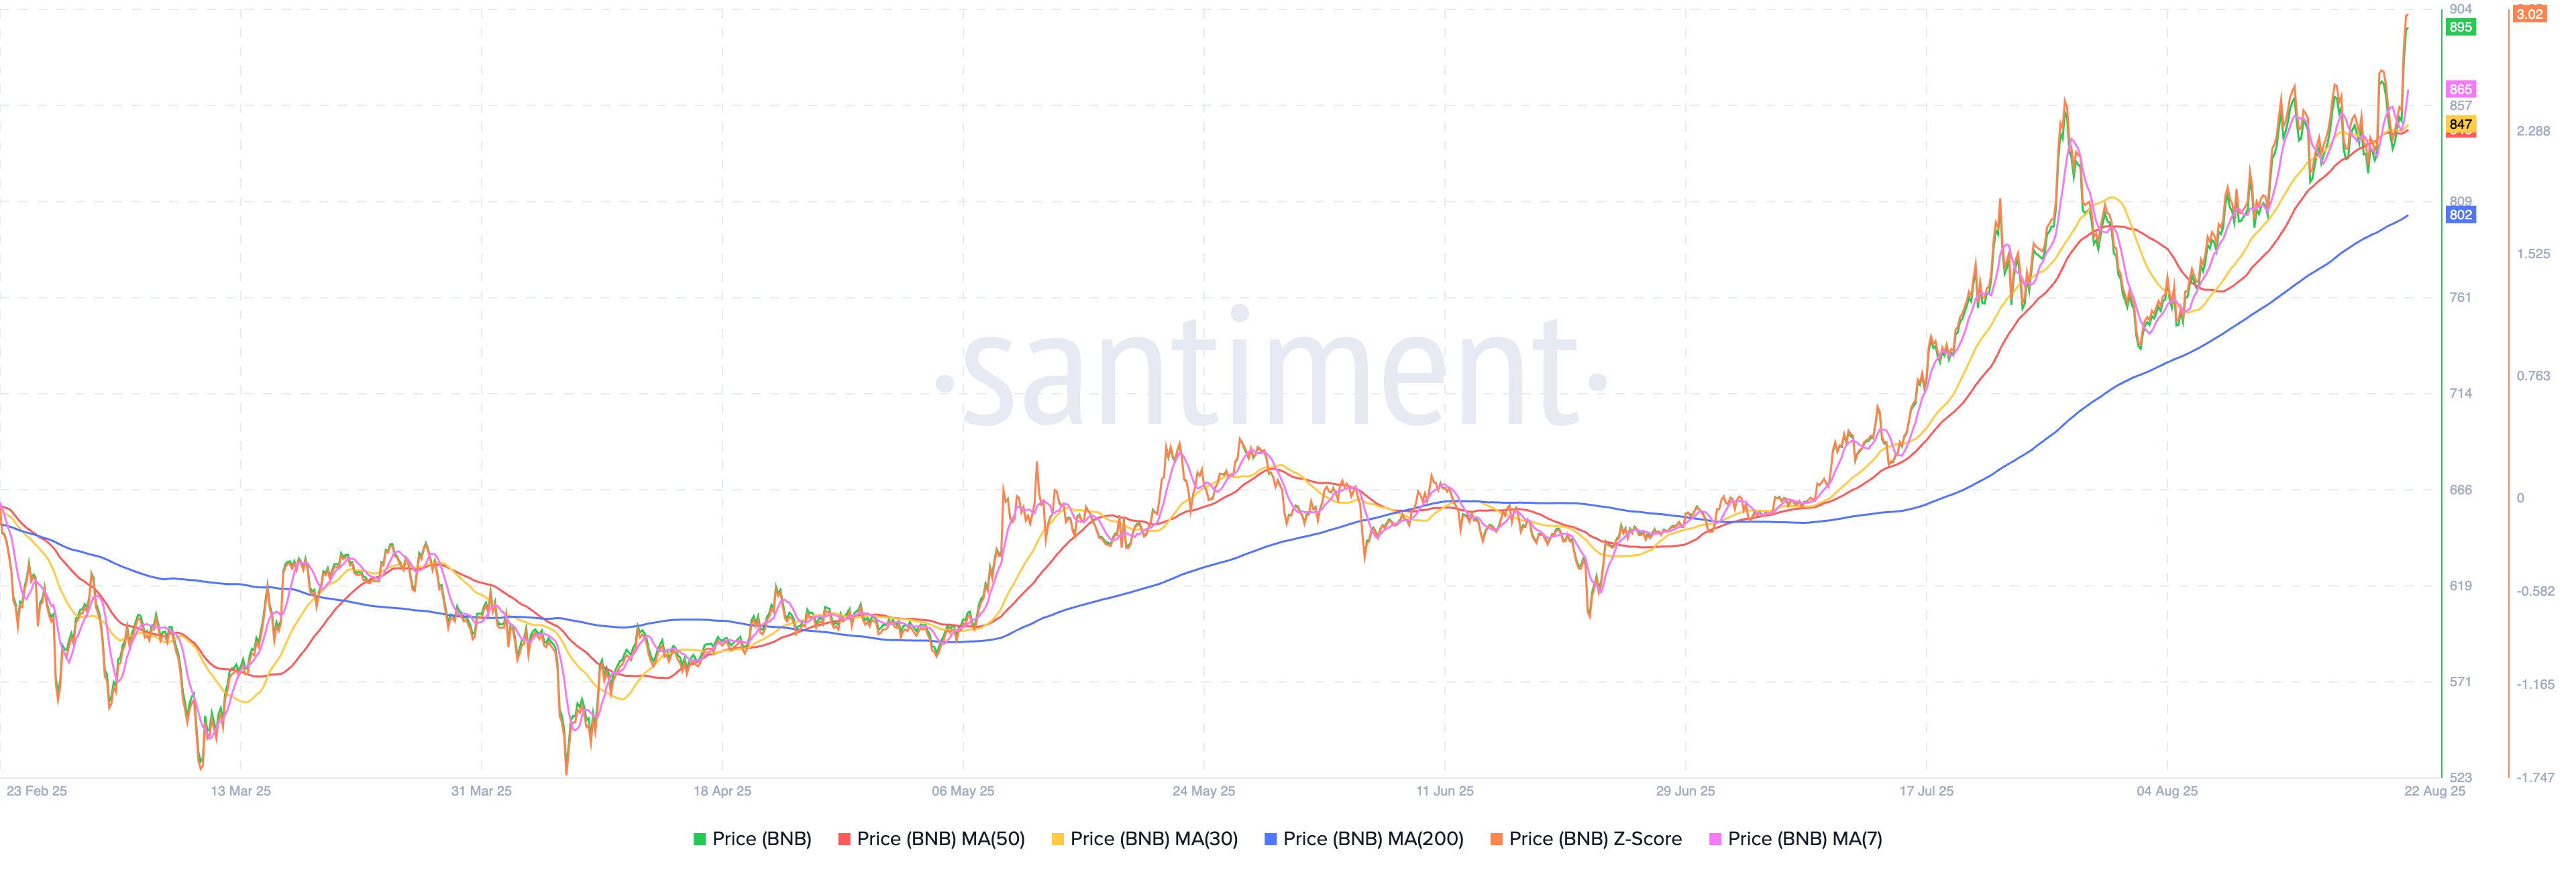
Binance Coin trending upward | Santiment
Indicators support this upward movement. The MACD is at 28.2, compared to a signal line of 24.8 (this is a bullish crossover), and the RSI (14) is at 68.45. This RSI reading is neutral-bullish, indicating there’s still space before reaching overbought levels.
TradingView’s technical dashboard is firmly tilted toward buyers, with 16 buy signals vs. only one neutral across major oscillators and moving averages.
The critical marker to watch is $880. Multiple analysts flagged that as the line in the sand: sustained closes above it open the door to a 127.2% Fibonacci extension at $923, last tested in July 2025. A decisive break there puts $950–$1,000 in play within days.
On the flip side, failure to hold $880 could see BNB slip back into the $848–$862 range, with downside targets into the $830s if momentum stalls.