


The XRP price has been left in the dust by the surging Ethereum as investors waited for a new catalyst and as three highly bullish chart patterns formed. Ripple token was trading at $3 on Monday, inside a narrow range it has remained in in the past few days. This price is about 90% above its lowest point in April.
XRP Price Chart Pattern Points to More Gains
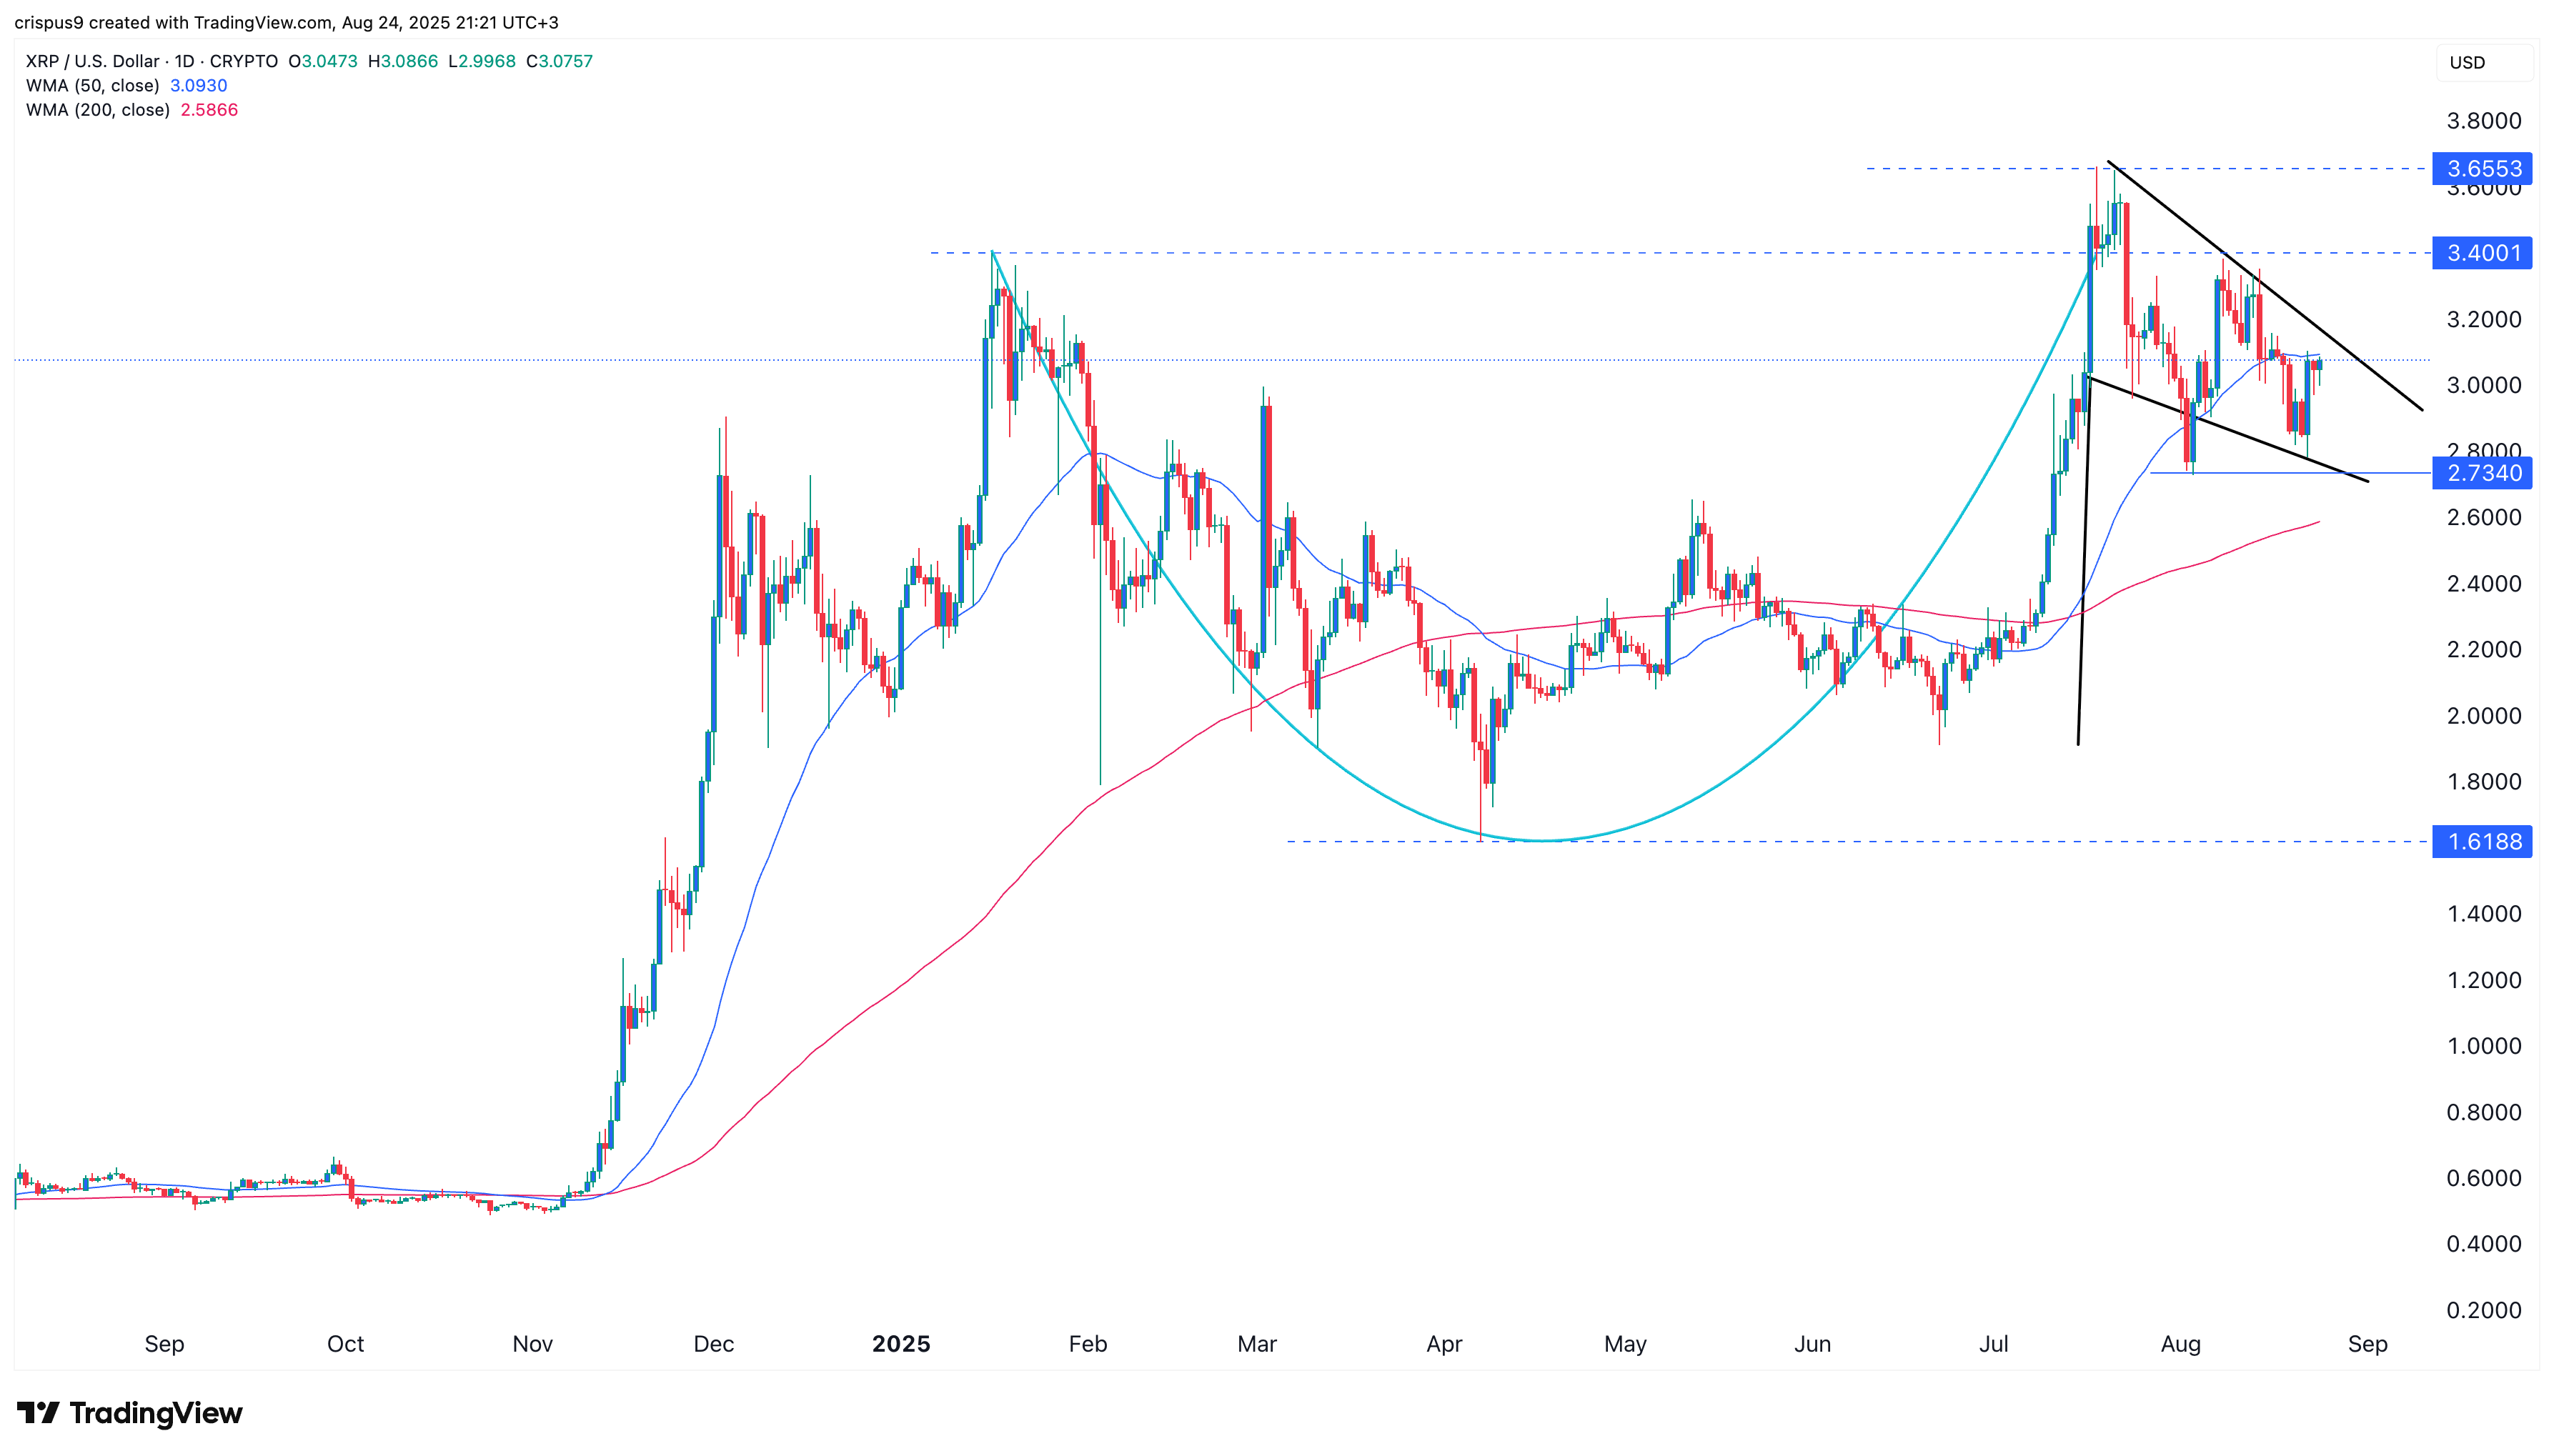
The daily timeframe chart shows that the XRP price has rebounded after bottoming at $1.6188 in April this year. While the price has pulled back recently, a closer look at the daily chart reveals at least three chart patterns indicating potential for further gains in the coming weeks.
First, XRP price formed a golden cross pattern on July 13. On this day, the 50-day Weighted Moving Average (WMA) crossed the 200-day one, which was a sign of gaining momentum.
Second, the token formed a bullish flag pattern, which comprises a vertical line and a descending channel. It has also formed a cup-and-handle pattern, which resembles a teacup, with its handle. The ongoing retreat is part of the handle section.
Therefore, the most likely XRP price forecast is highly bullish, with the next key resistance level at $5, up by 67% from the current level. This bullish forecast will be confirmed if it moves above the year-to-date high of $3.6553.
A drop below the support at $2.7340 will invalidate the bullish Ripple outlook. Such a move will push it lower, potentially to $2.50.
READ MORE: Crypto Bull Run: Why are Altcoins Like Arbitrum, Ethena, ETH Going Up?
Technicals Meet Fundamentals
The most bullish aspect of the XRP price is that, in addition to its strong technicals, it has strong fundamentals.
One of its top fundamentals is a sign that it is becoming a major player in the stablecoin industry. Ripple USD (RLUSD) has added over $20 million in assets in the last few days to $686 million. Its 30-day volume stood at over $2 billion, a trend that will accelerate after the recently passed GENIUS Act.
The other major catalyst for the XRP price is that most analysts believe that the SEC will approve spot ETFs later this year, giving it access to American institutional investors.
Recent indicators show that these funds will have billions in inflows in the initial years. Ethereum ETFs have added over $12 billion in assets, while Bitcoin has had $54 billion in inflows. Their ETF assets now account for about 6.45% and 5.2% of their respective market cap.
Based on XRP’s market cap of $181 billion, 5.2% in assets means that it may have close to $10 billion.
Ripple Labs is also working to become one of the top competitors to Swift, a leading financial institution that moves trillions of dollars a year. Other catalysts for the XRP price include ongoing whale buying and steady open interest.
READ MORE: Chainlink Price Prediction: Is LINK a Buy as Experts Accumulate?