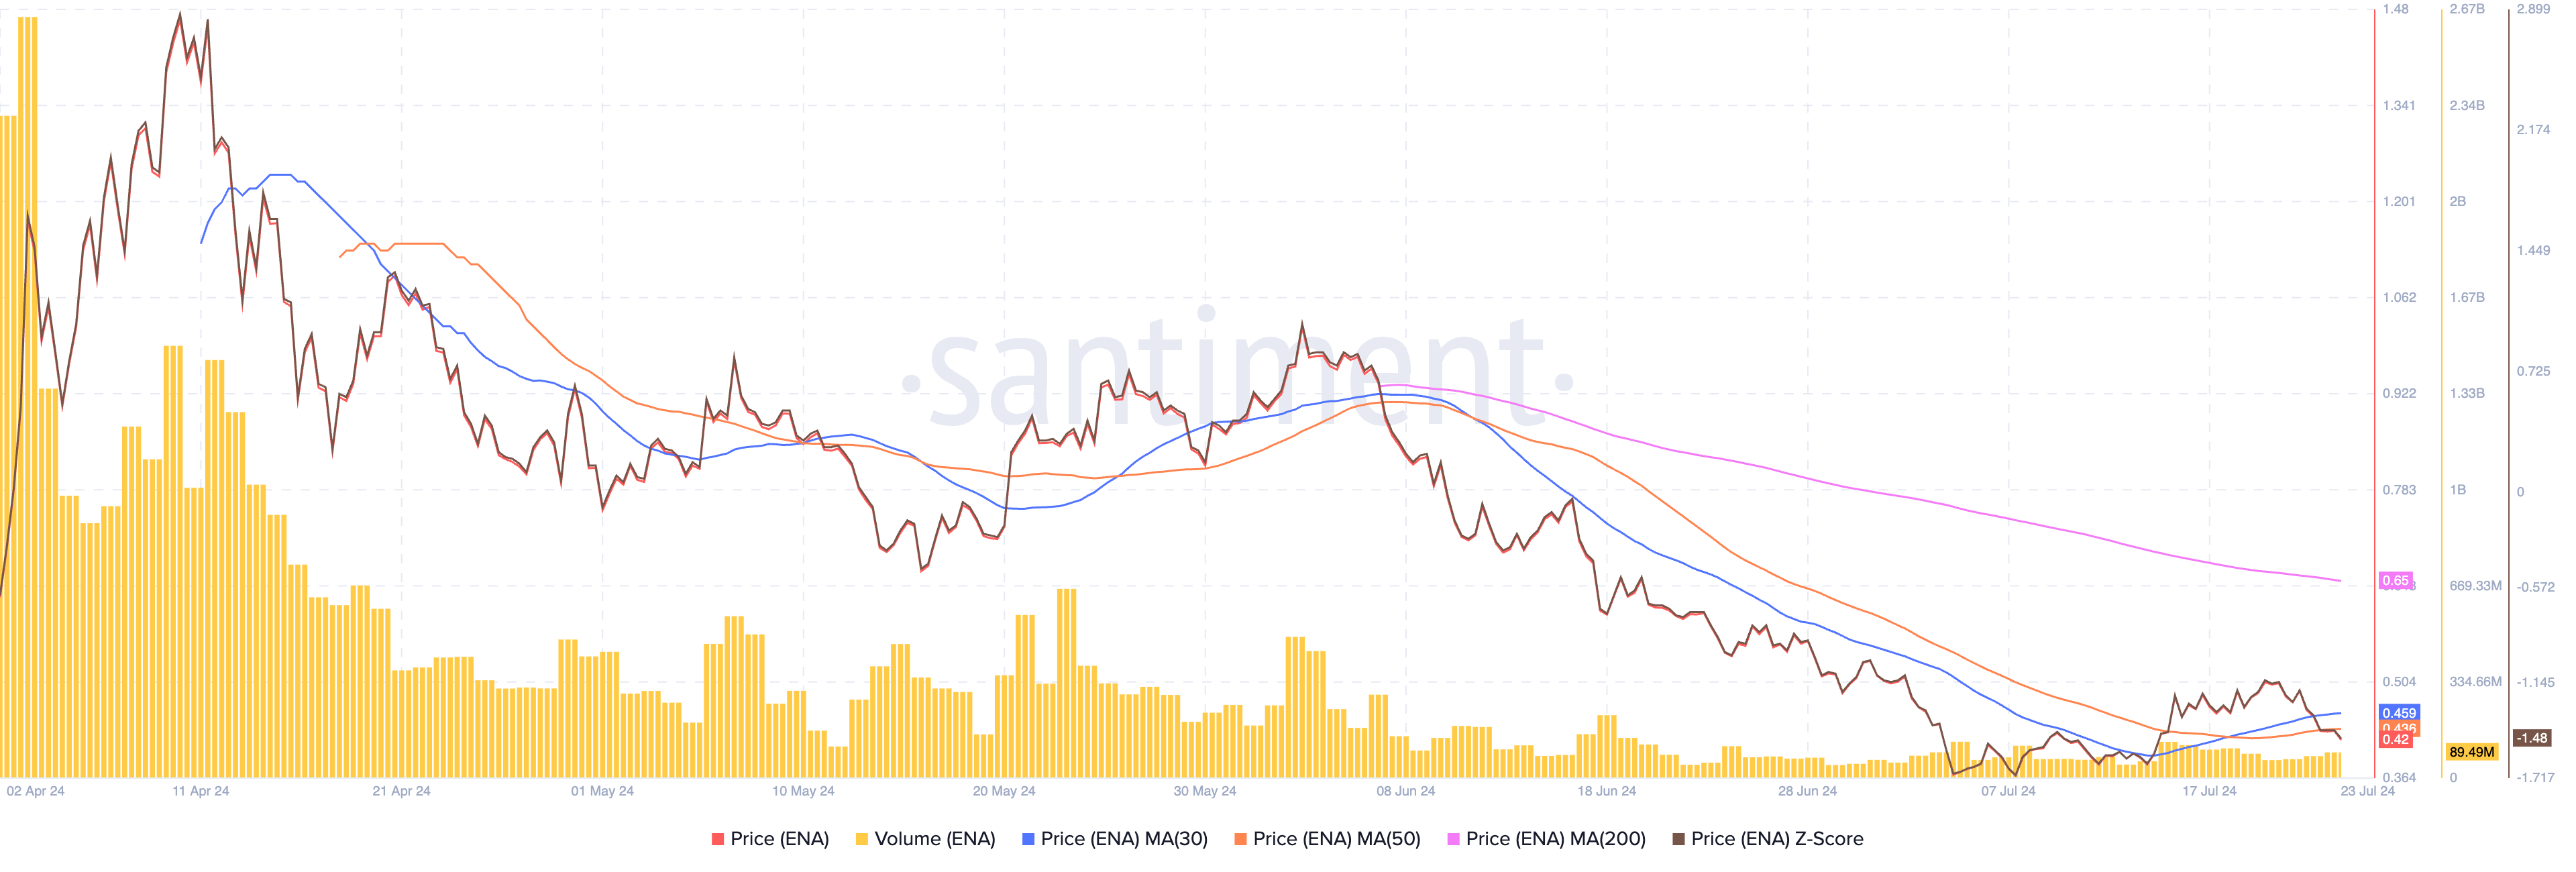
Ethena (ENA) token is trading under pressure despite a string of bullish developments, leaving traders split on whether the recent pullback is a shakeout or a warning sign. Ethena price declined 1.44% in 24 hours to $0.663, with a weekly drop of nearly 15%. However, on-chain activity, institutional purchases, and ecosystem expansion suggest a more optimistic outlook.
On-Chain Metrics Support the ENA Price
The broader crypto market remains volatile, with Bitcoin trading below $116,000 and Ethereum testing $4,470. Macro sentiment has been shaped by a $4.3 billion options expiry, prompting risk-off moves across altcoins. Against this backdrop, ENA has underperformed, even as liquidity and trading volumes show resilience.
While most altcoins are reacting to macro headwinds, Ethena-specific news has been supportive. YZi Labs, a long-standing backer, deepened its investment in Ethena Labs this week. That’s notable because YZi Labs was an early investor, and doubling down now signals strong conviction in Ethena’s model despite market volatility.
The protocol behind USDe, now the third-largest USD-denominated crypto asset, has also expanded with integrations on BNB Chain and major centralized exchanges.
Further, institutional players are stepping in, with Mega Matrix buying 8.46 million ENA tokens at an average of $0.7165. That’s noteworthy because a listed company allocating millions into ENA validates it as a serious asset and could spark further institutional interest.
On-chain metrics reinforce the bullish camp. Active addresses in September reached 41,000, placing Ethena fifth among stablecoin issuers. Revenue generation has also been impressive: Ethena captured $67 million in the past 30 days, ranking third among issuers with an 8.3% market share.
Supply dynamics are equally striking. Ethena’s outstanding supply has surged to $15.8 billion, with token holders climbing above 77,000, both metrics firmly in “up only mode,” according to analysts.
Ethena Price Chart Signals: Key Levels to Watch
Charts suggest Ethena price is caught between bearish short-term momentum and bullish medium-term structure. TradingView indicators show the token hovering below key resistance levels at $0.70 and $0.75.

Moving averages are sending mixed signals: the 50-day and 100-day EMAs sit above current prices, implying near-term pressure, while long-term moving averages point to a possible recovery.
The Relative Strength Index (RSI) is neutral at 43, leaving room for upside before overbought conditions return. MACD momentum remains flat, but traders on social media argue the current dip resembles a shakeout phase. A sustained break above $0.70 could open the path toward $0.90, while failure to hold $0.65 risks a retest of $0.55 support.
READ MORE: NEAR Protocol Price Prediction: Traders Target $38–$40 After Breakout


