


Pi Network price has moved sideways this month, continuing a trend that has been going on in the past few months as investors ignored key bullish catalysts. The token was trading at $0.3535, a few points above the August low of $0.3225. This article explores some key risks that the market is ignoring.
Pi Network Price is Ignoring Whale Buying
The most notable catalyst that investors are ignoring is the ongoing accumulation by an obscure whale.
PiScan data shows that the whale has been on a buying spree in the past few weeks, bringing his holdings to 381 million tokens, currently valued at over $134 million.
It is not possible to identify who this whale is and why he is in an accumulation mode. What is clear, however, is a highly confident investor who believes that the coin is undervalued and about to rebound in the near term.
Most notably, this could be a well-connected investor who has information that will benefit the coin. For example, as we have written before, this investor could be connected to an exchange like HTX, Binance, or Upbit, which may be preparing to list.
READ MORE: Top Cryptocurrencies to Watch this Week: Keeta, Axelar, Aster
An exchange listing by one of the major centralized exchanges would be highly bullish for the coin, as we have seen with other tokens, some of which jump by over 100%. Pi Network, as one of the most popular cryptocurrencies, would likely experience a significant increase in value if listed by a major exchange.
The whale may also know when or whether the Pi Core Team will announce a token burn, which could trigger a parabolic move, similar to what we saw with the OKB token, whose price surged by over 300% within a few days after the announcement.
Pi Coin Has Formed a Bullish Reversal Pattern
The other catalyst that the crypto market is missing is that the Pi Network price has strong bullish technicals that may push it higher in the coming weeks.
One of these technicals is that the Pi Coin has slowly formed a highly bullish falling wedge pattern on the daily chart. This pattern is made up of two descending and converging trendlines, with a bullish breakout forming when they near their confluence.
The two lines are now nearing the confluence level, pointing to a strong bullish breakout.
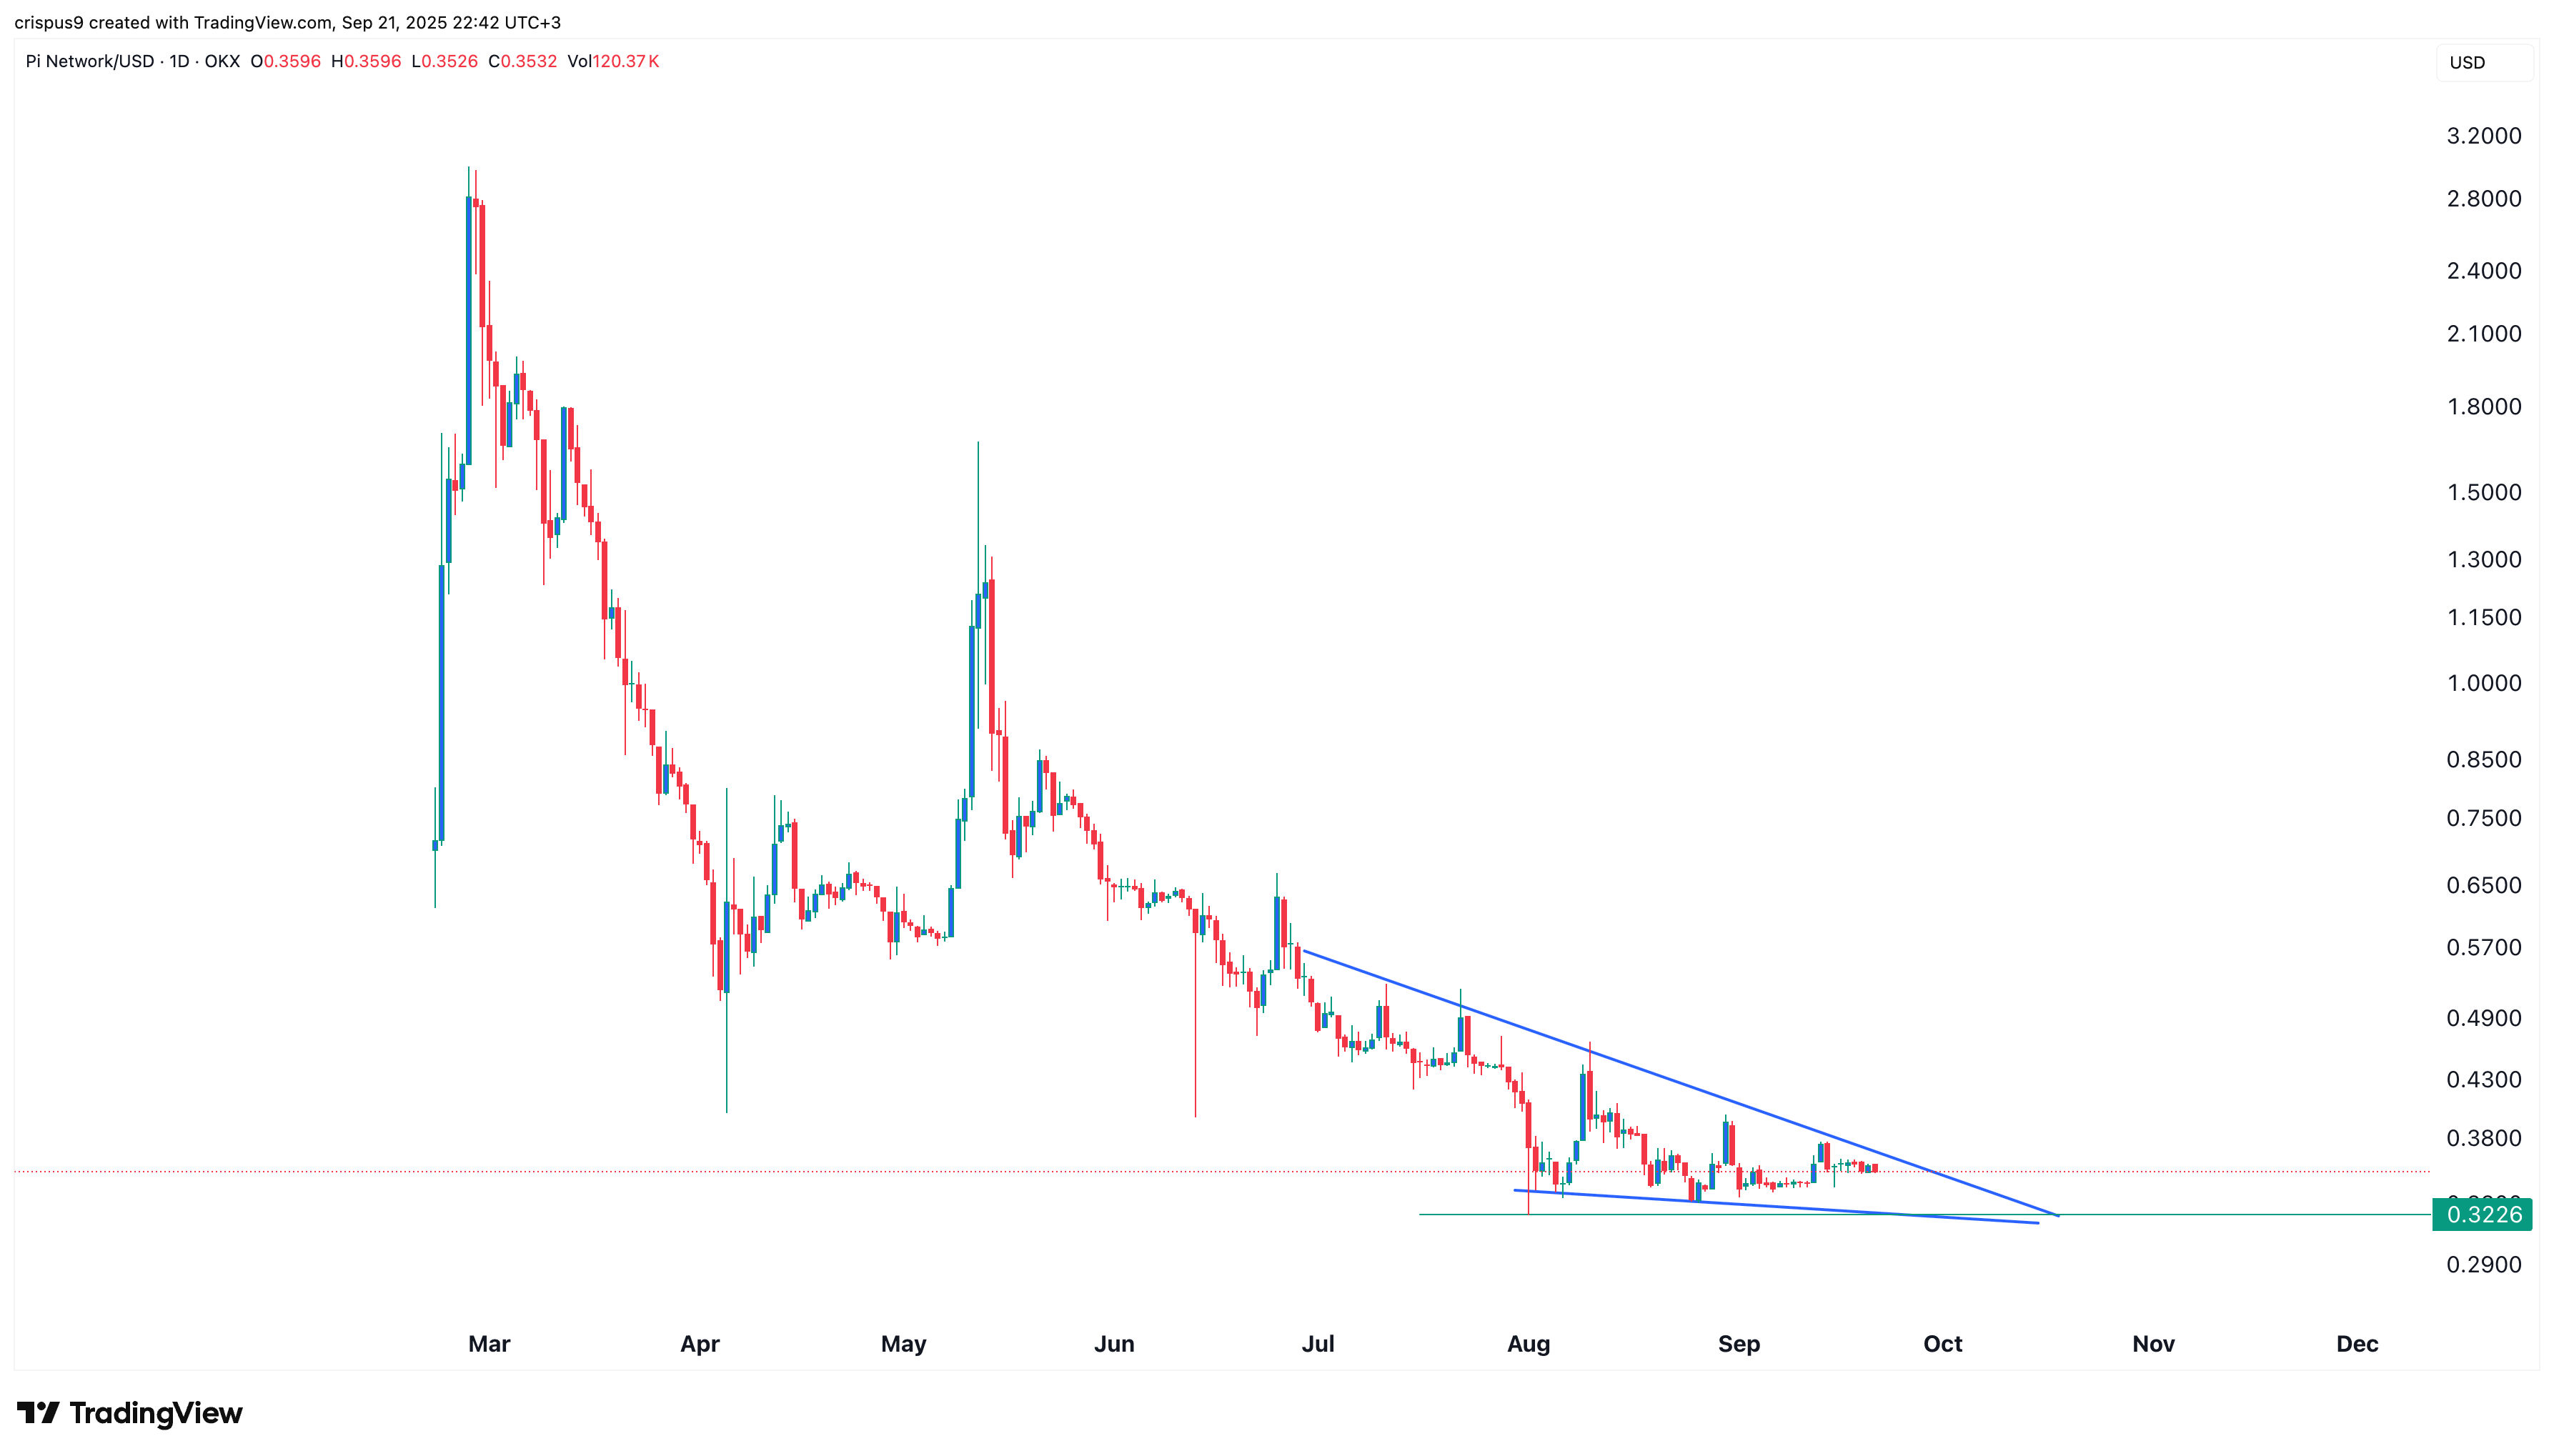
Also, the daily chart shows that the coin has failed to move below the important support level at $0.3400. That is a sign that sellers are afraid of placing trades below that level, which is a bullish sign.
READ MORE: Ondo Crypto Price Forms Rare Bullish Pattern as Key Metric Surges