


Peter Brandt, a legendary trader and author, delivered a highly bearish XRP price prediction. In an X post, he identified a rare pattern, which, if it works, could lead to more Ripple price downside. This article explores why his forecast is wrong.
Peter Brandt Delivers a Bearish XRP Price Prediction
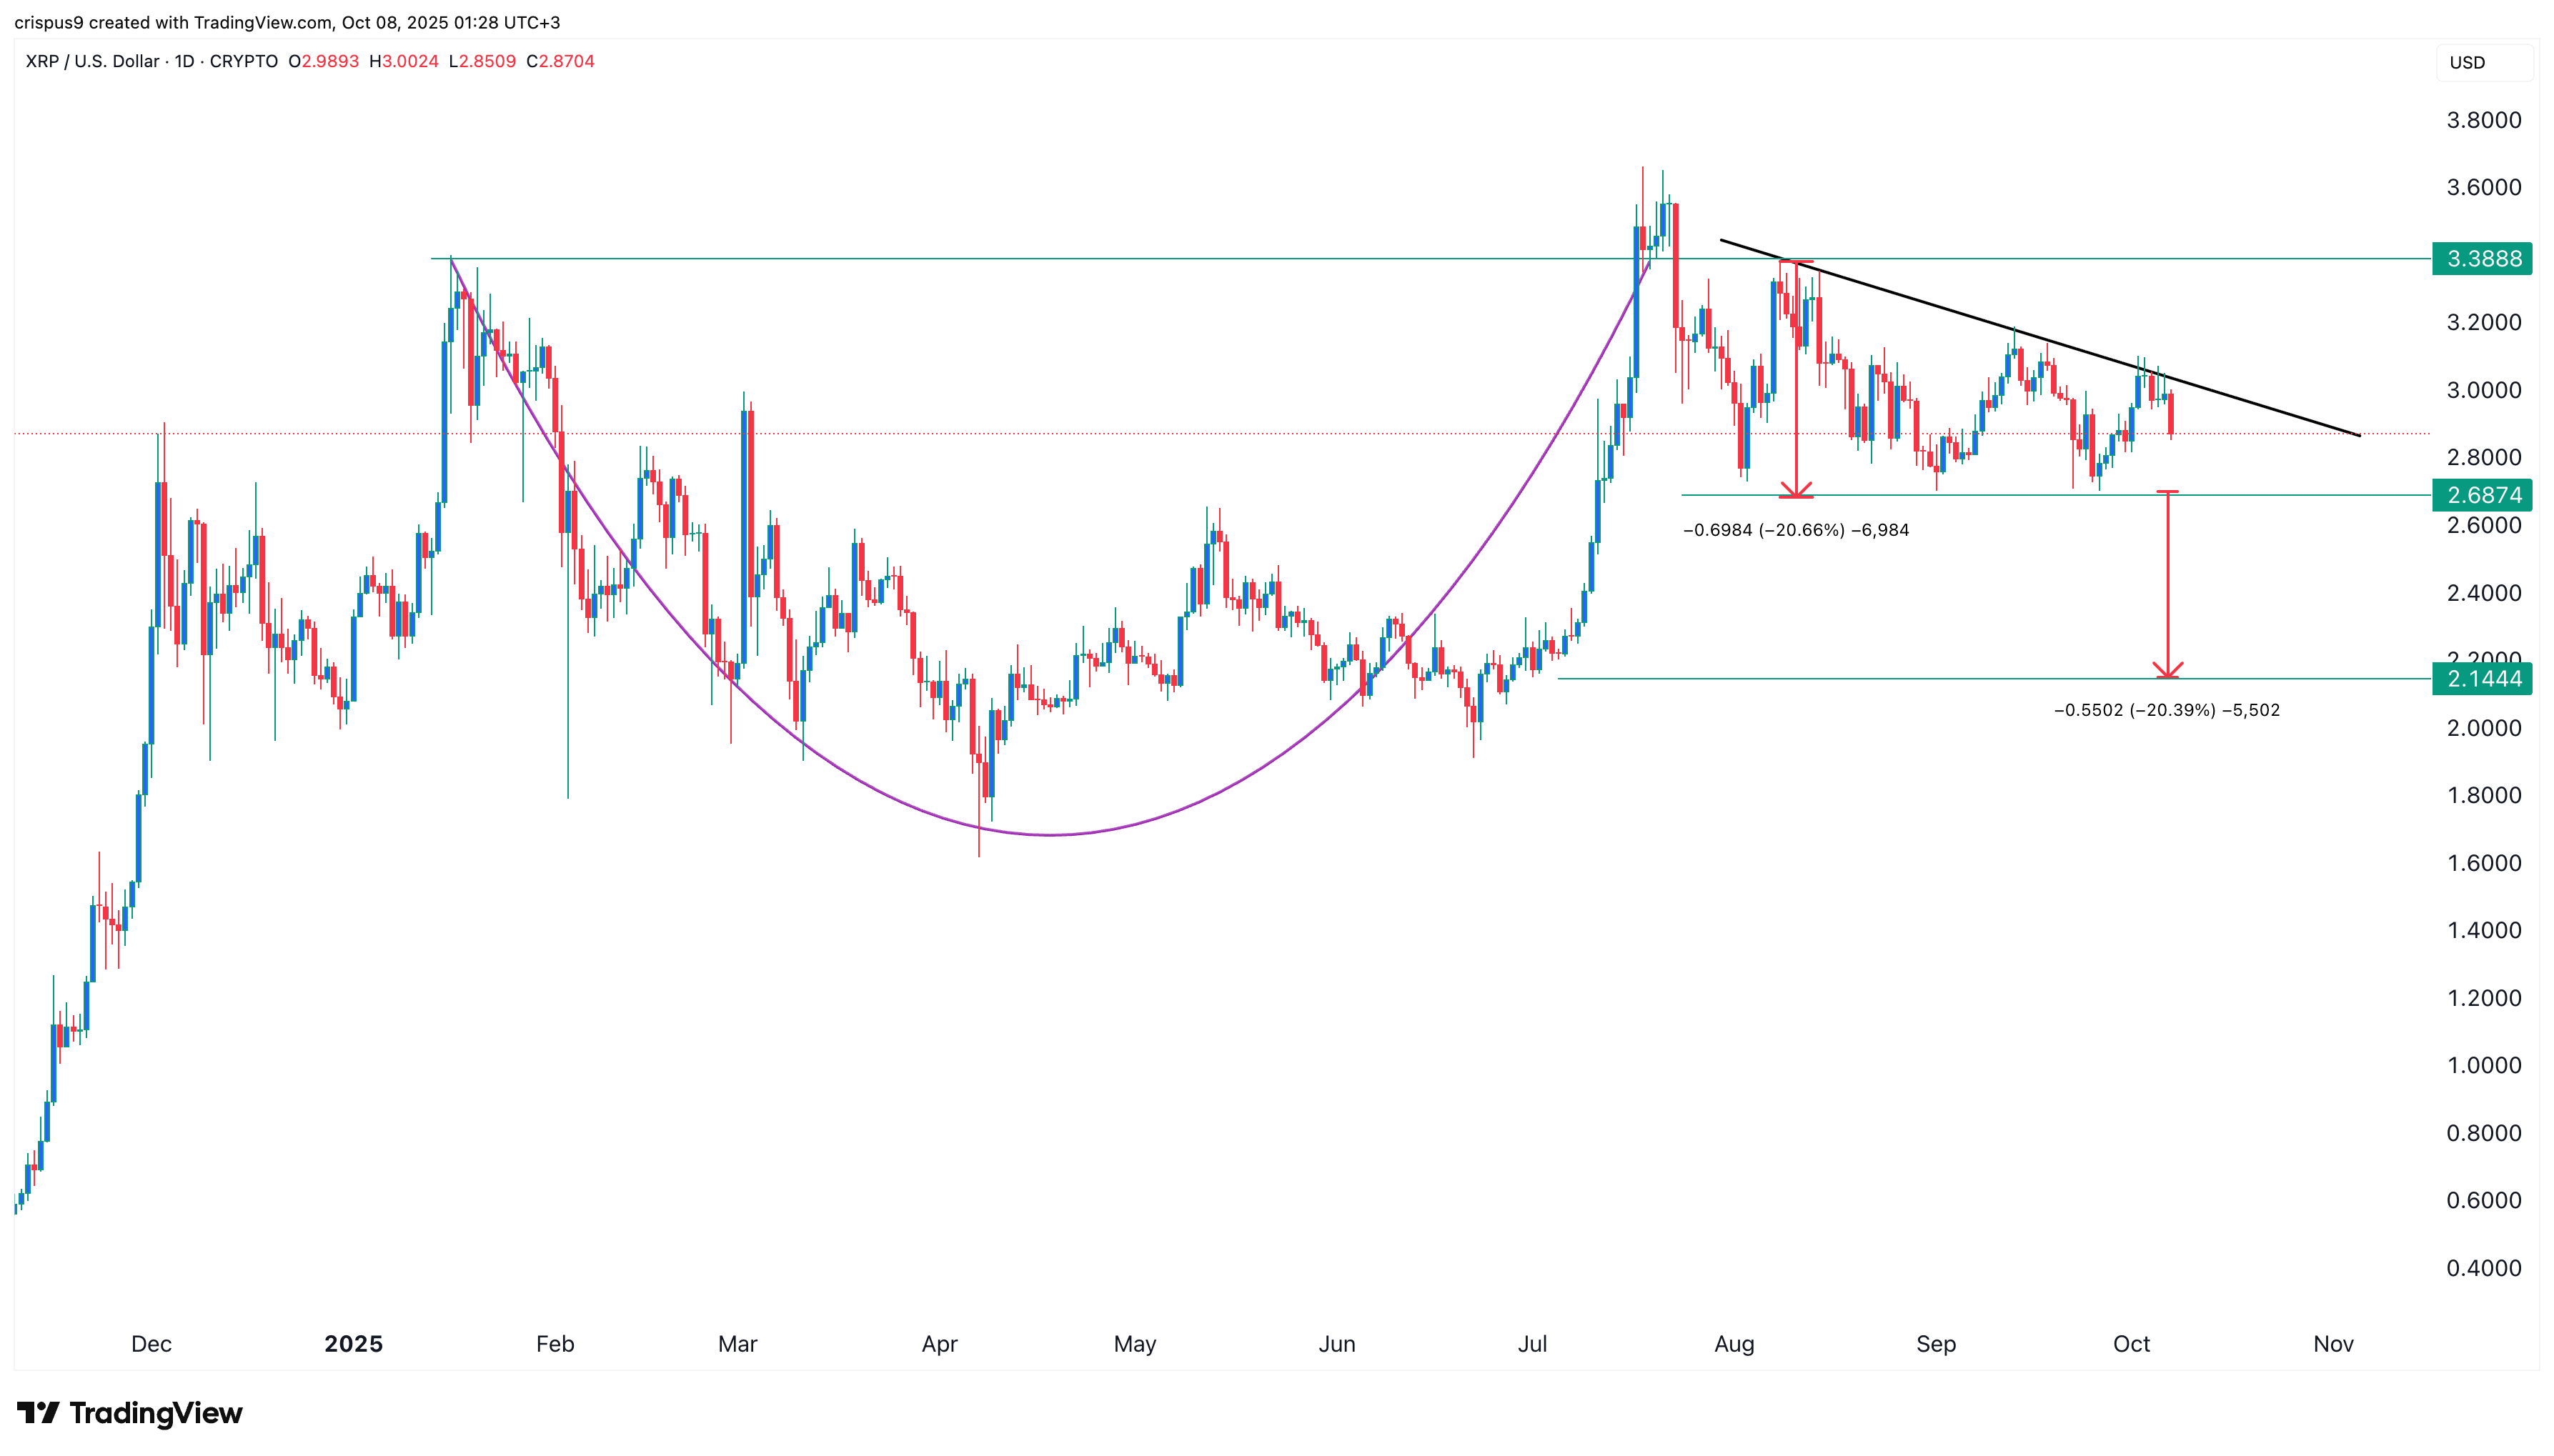
In his post, Brandt identified a forming descending triangle pattern on the daily chart. This pattern is characterized by a horizontal support, which, in this case, is at $2.6878. It also has a diagonal line, which connects the highest swings since August 8.
Brandt believes that the coin will have a strong bearish breakout in the near term. He expects the descending triangle to be confirmed when it moves below the lower side of the triangle pattern.
In this case, the distance between the depth of the widest part of this pattern is about 20%. If the breakout happens, it means the price will drop to the next key support level at $2.14, the lowest level since July.
READ MORE: What is Happening With Hedera Hashgraph (HBAR) Stablecoin Supply?
The Bullish Case for the Ripple Price
There are at least three main reasons why Brandt’s XRP price forecast is wrong. First, XRP has fundamental catalysts that will likely trigger a short-squeeze. One notable catalyst is that the SEC is expected to approve spot XRP ETFs as soon as next week, pending the end of the government shutdown.
This approval could lead to substantial inflows from American investors, as they have done with Bitcoin and Ethereum ETFs. Bitcoin ETFs have seen cumulative inflows of over $61 billion since January last year, while Ethereum funds have added more than $14 billion. XRP ETFs are expected to generate over $8 billion in inflows, which is expected to boost their price.
Second, while the XRP price has formed a descending triangle pattern, it has also formed several other highly bullish chart patterns. The triangle pattern that Brandt notes is likely part of the bullish pennant pattern, which often leads to a strong bullish breakout over time.
Also, the ongoing price action is part of the handle section of the cup-and-handle pattern, which also often leads to a strong bullish continuation.
The coin has also formed a falling wedge pattern, and most importantly, the pullback is part of the second phase of the Elliot Wave pattern. This phase is characterized by a pullback that retraces about 50% or 61.8% of the first wave. It is then followed by the third wave, which is usually the longest.
Therefore, the most likely scenario is one where the XRP price rebounds in the coming weeks and reaches its all-time high of $3.67, followed by the psychological level of $5 as ETF inflows begin.
READ MORE: Avalanche Price Prediction as Burned AVAX Coins Nears 5M