


Shiba Inu price has moved sideways over the past few days, even as the broader crypto market rally gained momentum. The SHIB token was trading at $0.00001237 on Thursday, a range it has maintained since September 23.
Shiba Inu Price Stalls Amid Mixed On-Chain Metrics
The SHIB coin price has remained in a tight range in the past few weeks. Data compiled by Nansen showed that the amount of coins in exchanges has been in a downward trend in the past few months.
There are about 276.8 trillion coins in exchanges today, down from over 280 trillion on September 9. Falling exchange balances indicate that investors are transferring their coins from exchanges to their self-custody wallets.
Shiba Inu whales have also continued buying their coins in the past few weeks. Data shows that there are over 183.56 billion tokens, up from this month’s low of 98 billion. This means that these investors have bought 85 billion coins.
READ MORE: Here’s Why Trump Coin and WLFI Token Prices are Crashing
Whales have bought over 148 billion coins in the last 30 days. This is notable since the accumulation has gained steam. Public figure investors have also continued buying their coins. They now hold 399 billion tokens, up from their previous levels over the past few days.
Meanwhile, Shiba Inu’s futures open interest has remained at $191 million, down from last month’s high of $237 million. Additionally, the coin’s volume has continued to fall in the past few months, a sign that demand has waned.
SHIB Price Technical Analysis
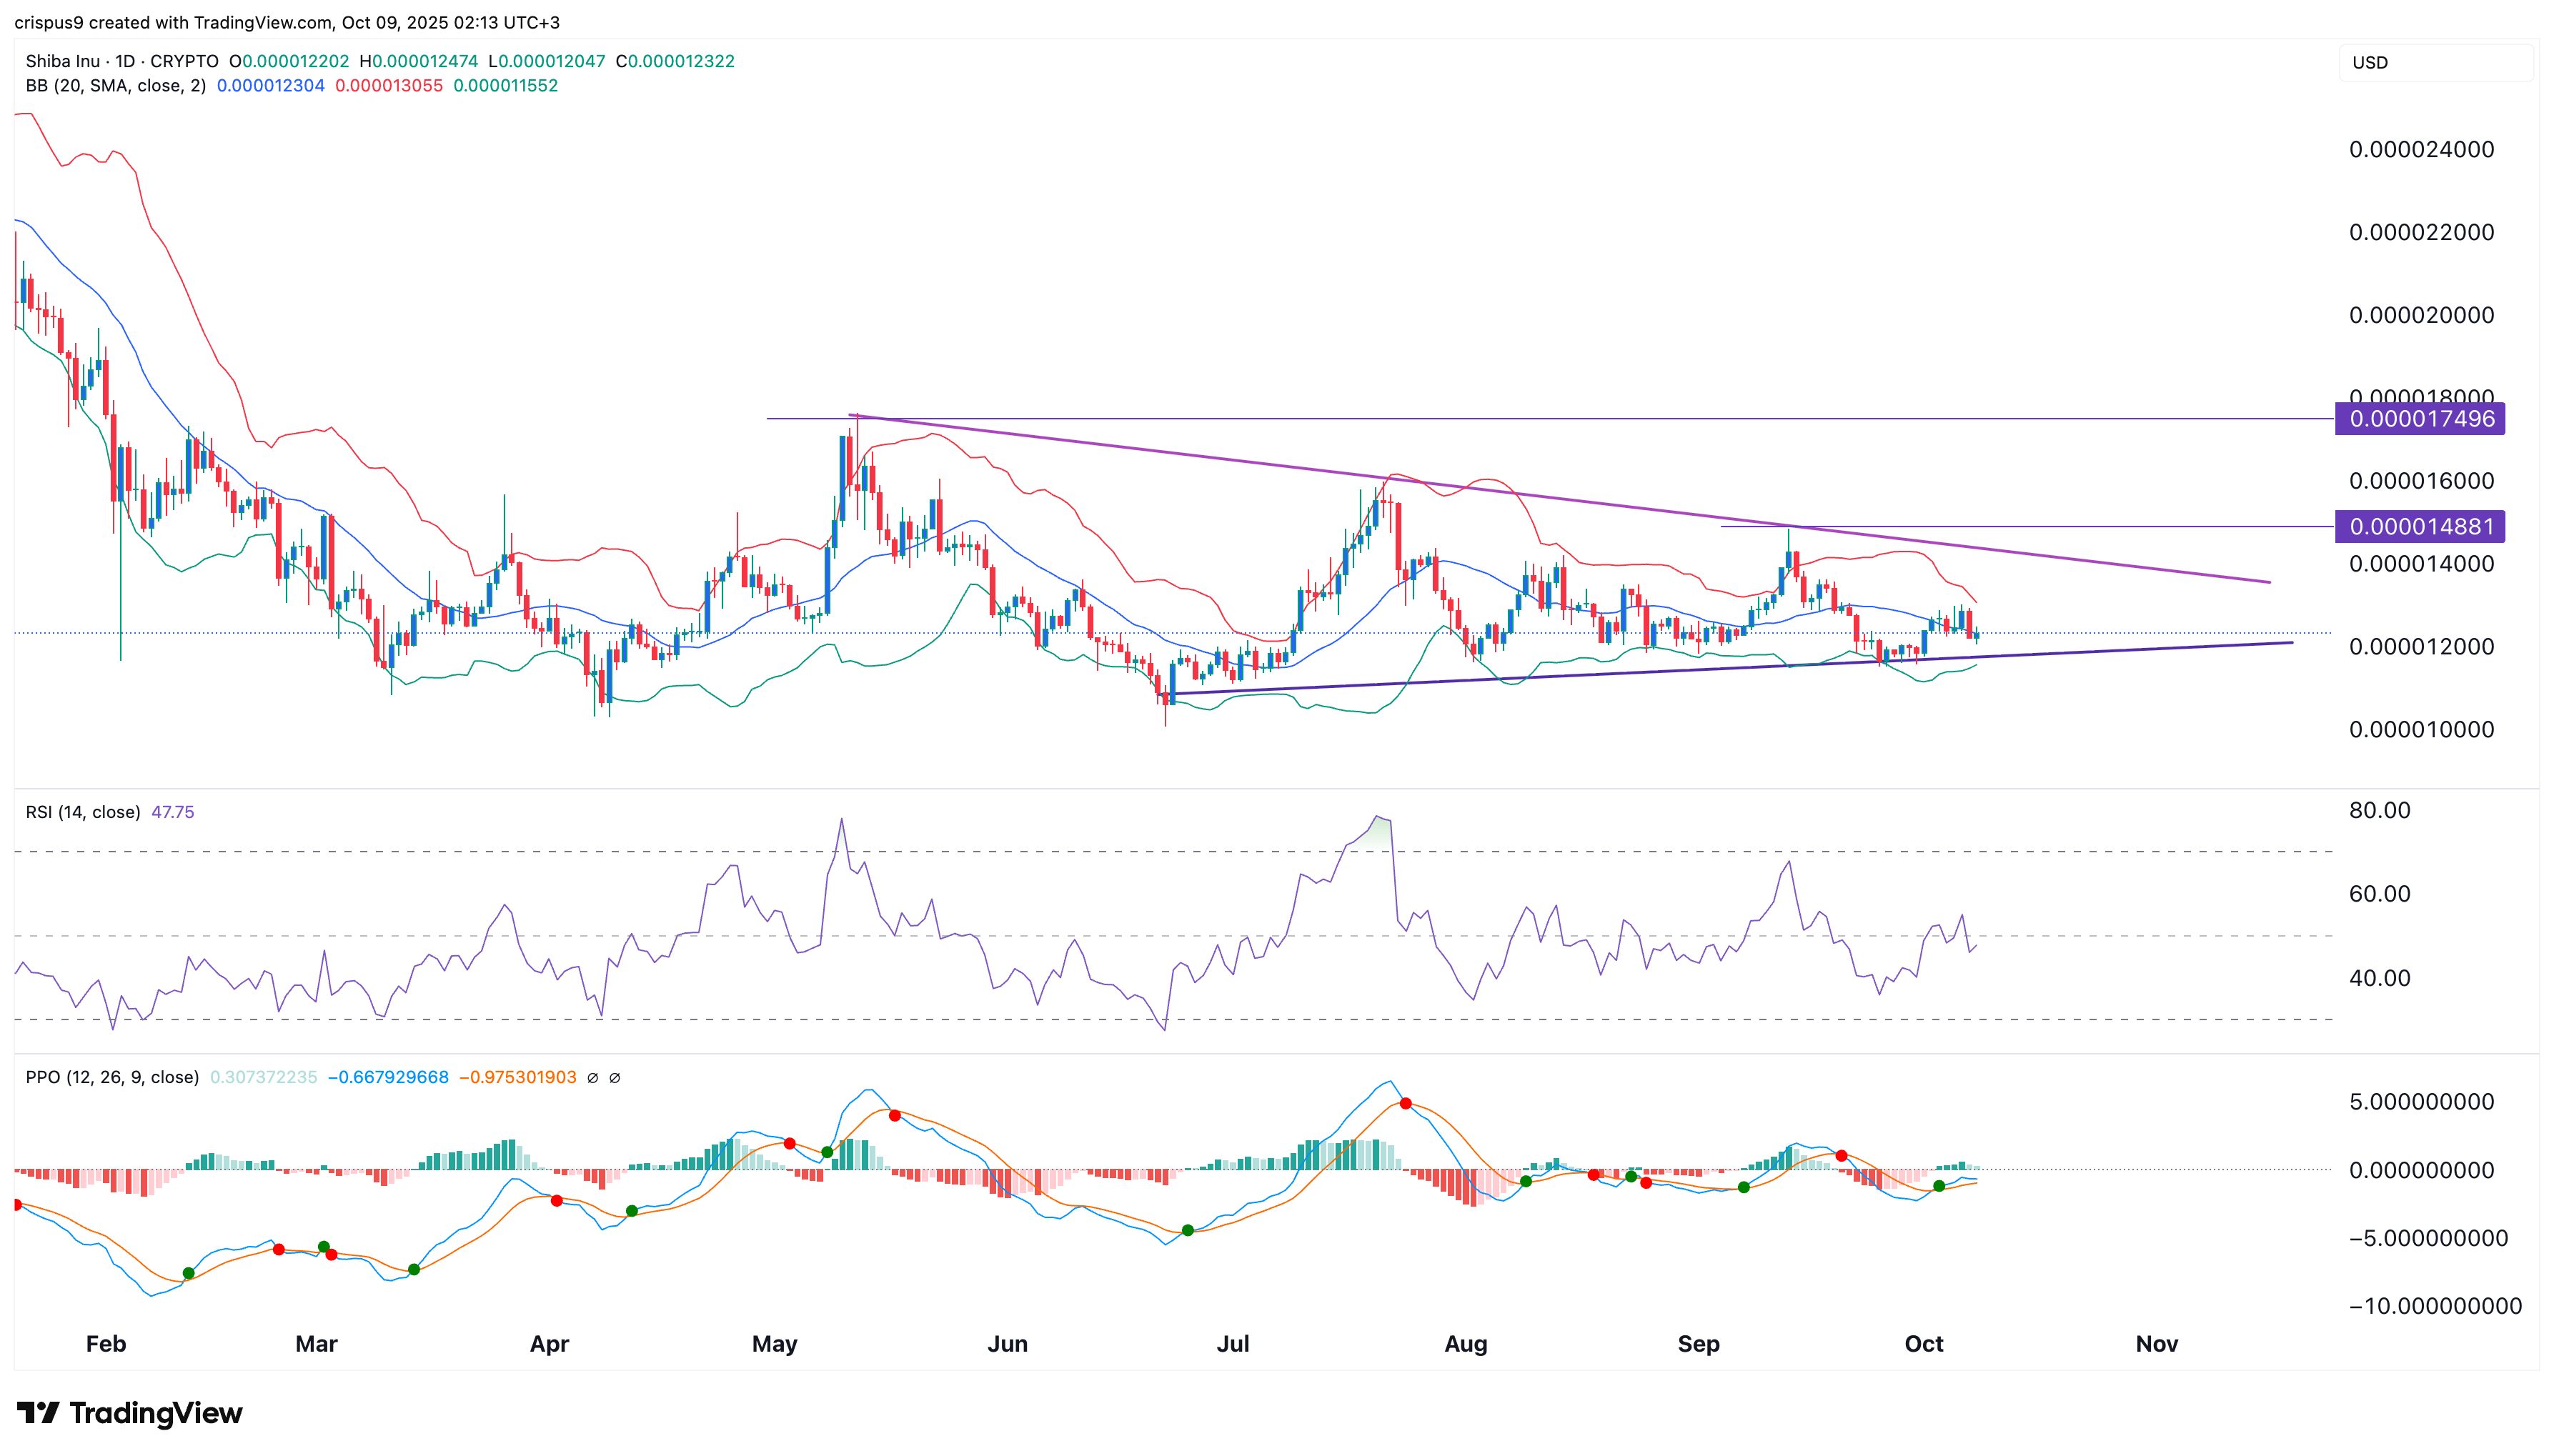
The daily timeframe chart shows that the SHIB price has remained within a tight range over the past few months. It has formed a symmetrical triangle pattern, and the two lines are nearing their confluence.
The spread between the three lines of the Bollinger Bands has narrowed. In most cases, this performance typically leads to a short squeeze.
Shiba Inu’s Relative Strength Index (RSI) has moved below the neutral point at 50. Also, the Percentage Price Oscillator (PPO) has remained below the neutral point.
Therefore, the most likely scenario is where the Shiba Inu price remains in the current range and then bounces back in the coming weeks. A bullish breakout will see it jump to a high of $0.00001488, its highest level since September 13, representing a 21% increase above the current level.
On the other hand, a drop below the lower side of the triangle pattern will invalidate the bullish outlook. Such a move will likely indicate further downside, potentially reaching the support level at $0.00001.
READ MORE: Here’s Why Peter Brandt’s XRP Price Prediction is Wrong