


Zcash price resumed its bullish trend, hitting a high of $355, a few points below this month’s high of $385. It has now jumped by over 950% from its September low this year. So, can the ZEC price jump to $500 this year?
Zcash Price Bull Run Continues
The ZEC price has been in a strong bull run this month following Grayscale’s announcement of the launch of the Zcash Trust. This trust has become highly successful, having crossed the $100 million milestone last week, bringing its total assets to $137 million.
The ZEC trust has performed well despite its 2.50% expense ratio, meaning that investors with $10,000 in assets pay a whopping $250 in annual fees. There is a likelihood that Grayscale will file to convert it into an ETF as it did with Solana, Bitcoin, and Ethereum.
Zcash price has also jumped after a recent bullish forecast by Arthur Hayes, the founder of BitMex and one of the most popular players in the crypto industry.
In a recent X post, he predicted that the coin would jump to $1000 in the near term, implying a 183% upside from the current level. Such a jump is possible, as the coin has already risen by almost 1,000% over the past few weeks.
READ MORE: Pepe Coin Price Crash and the $7.1 Billion Wipeout Explained
It would bring its market cap to $16 billion, well above Monero’s, the biggest player in the privacy token space. Monero has a market cap of about $6.2 billion.
Zcash price has also jumped as many users have gravitated towards privacy tokens. This is evidenced by the rising number of shielded ZEC tokens, which recently jumped to 4 million. Shielded tokens are those whose transaction details, like sender, receiver, and amount, are hidden.
ZEC Price Technical Analysis
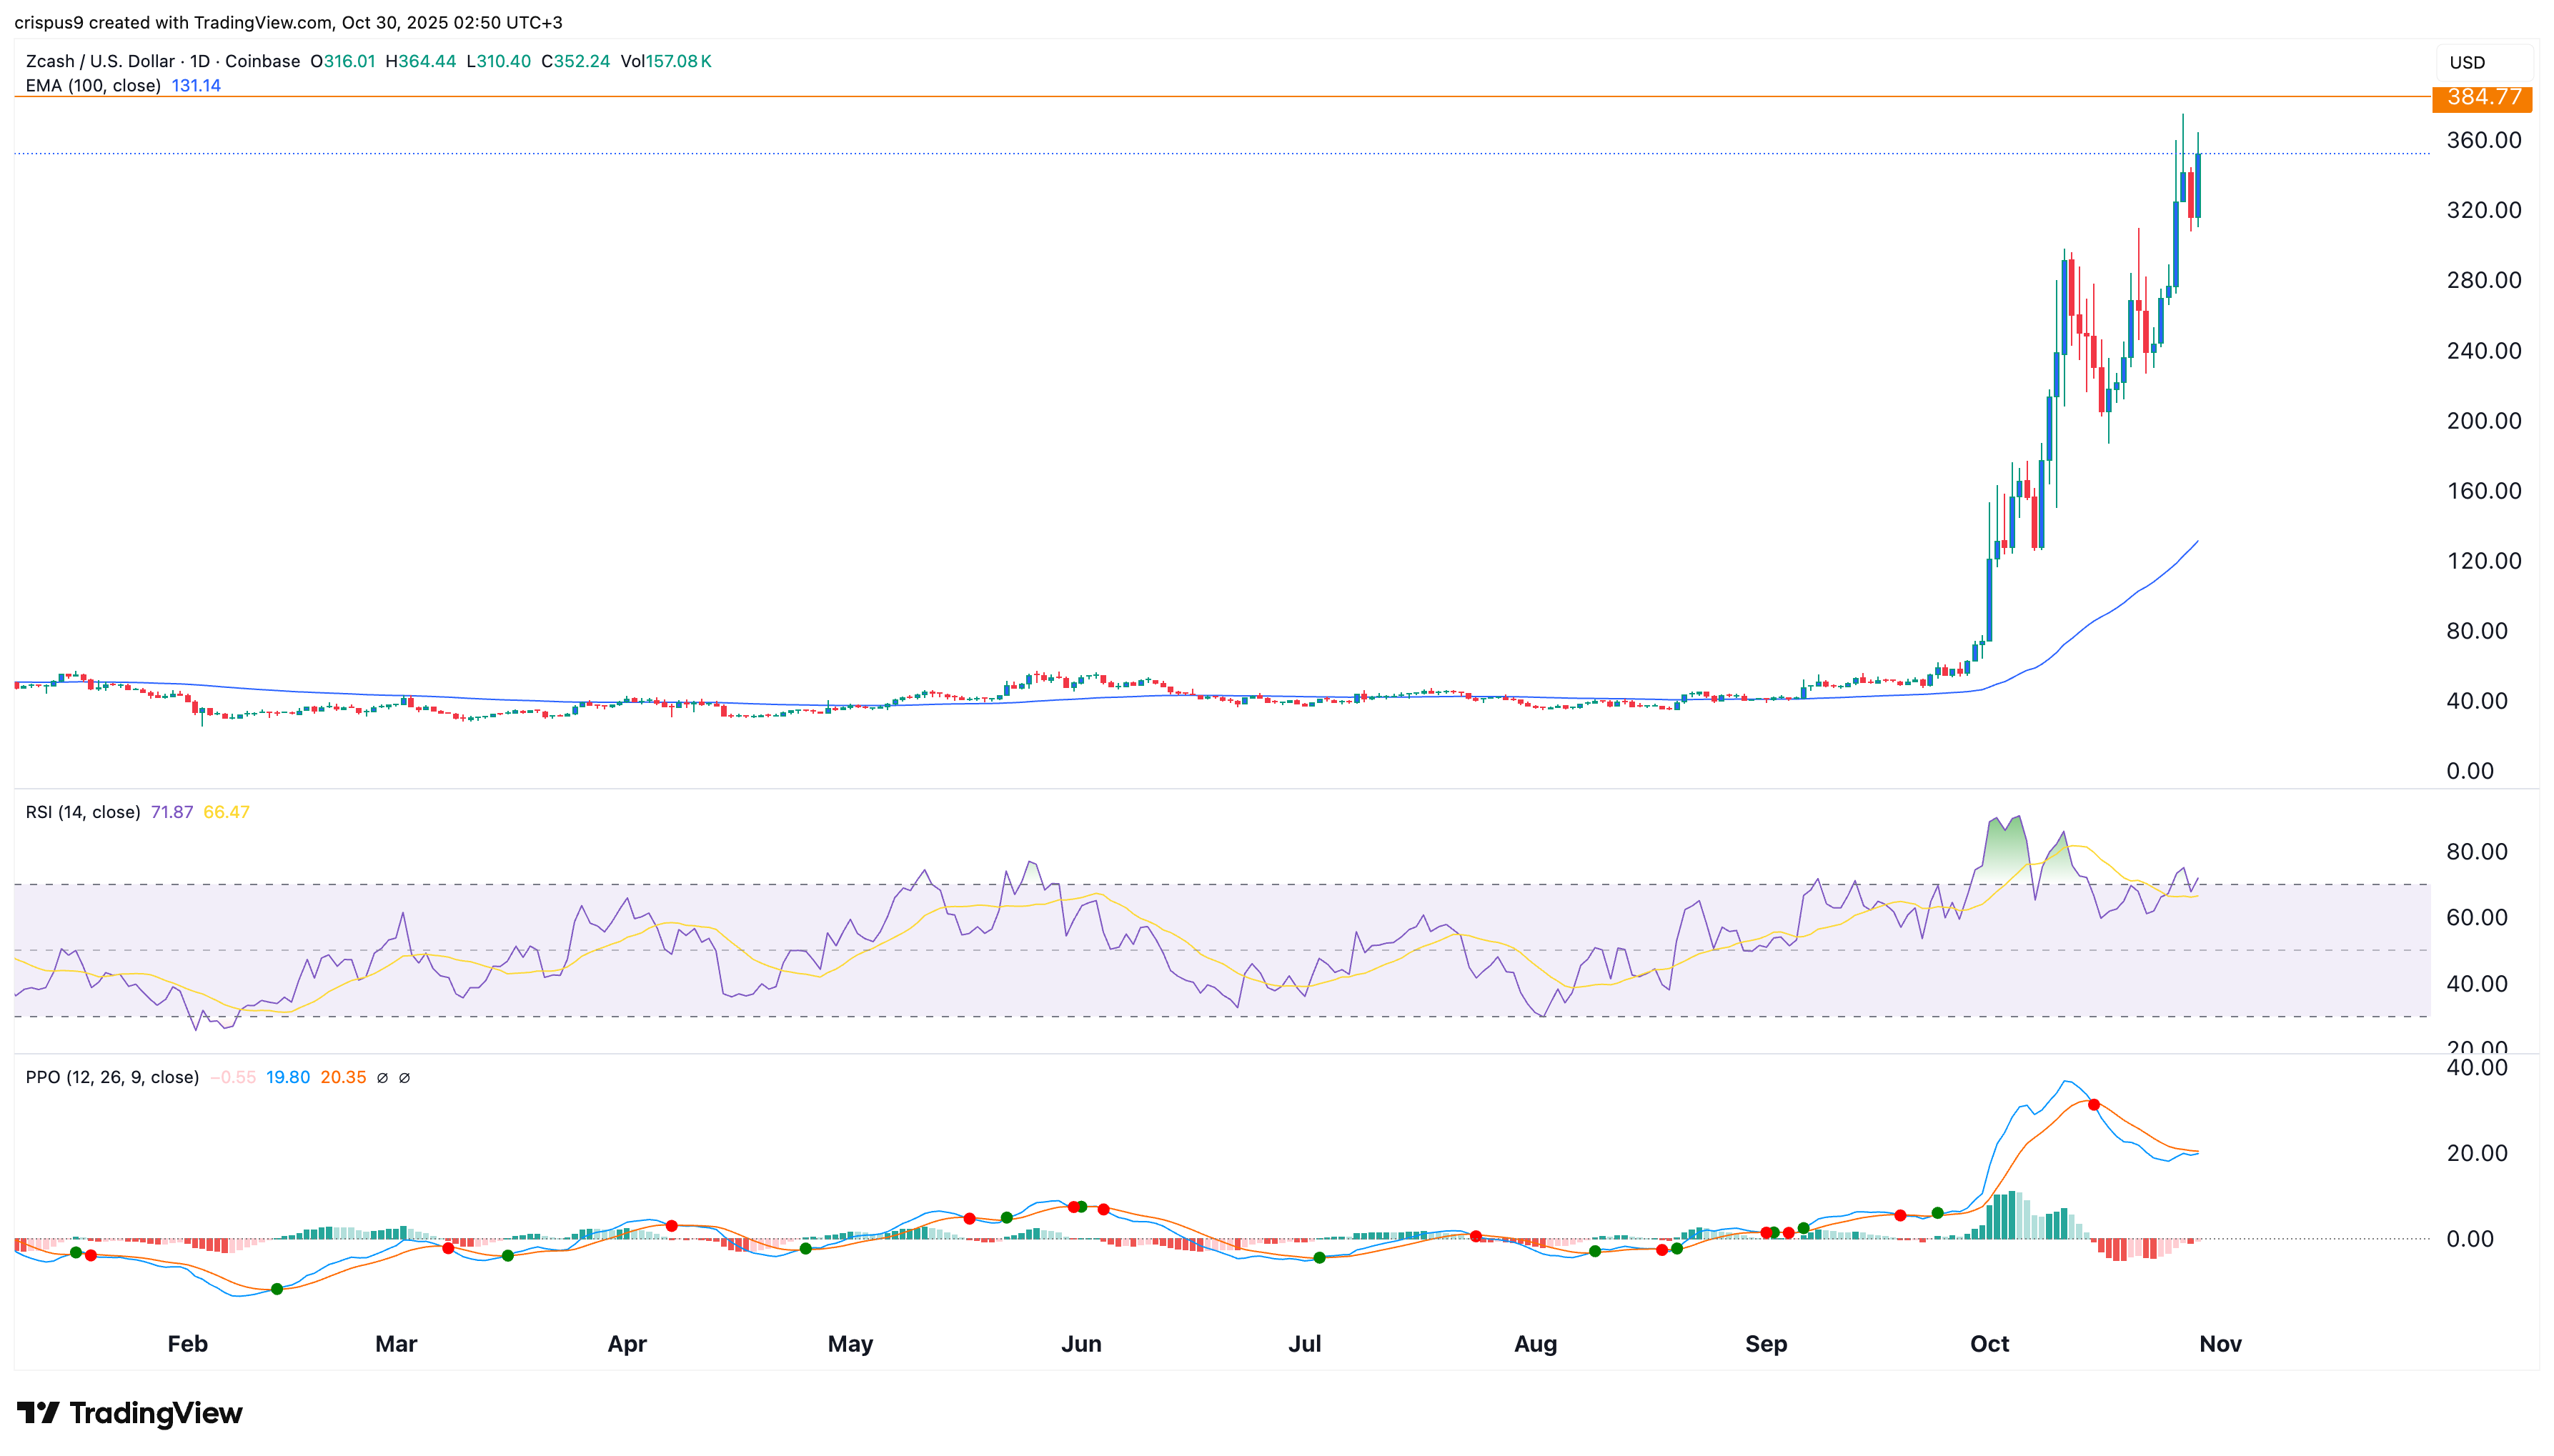
The daily chart shows that the Zcash price has been in a strong surge. This rally accelerated as the network entered the markup phase of Wyckoff Theory. Markup is characterized by high demand and the fear of missing out (FOMO).
The risk, however, is that the token may now move to the distribution phase, where the bull run loses momentum. Additionally, there is a risk that the coin has entered a bearish divergence, as the Relative Strength Index (RSI) and the Percentage Price Oscillator (PPO) have continued to fall.
The other key risk is mean reversion, in which an asset returns to its historical average. This reversion occurs when an asset moves farther from these averages. For example, the price is now $352, well above the 100-day average of $131.
READ MORE: XRP Price Prediction: Murrey Math Analysis Ahead of Fed Decision