


XRP price has remained under pressure and entered a bear market despite ongoing network growth. Ripple token was trading at $2.50, down by over 37% from the year-to-date high. So, will the token rebound as Ripple USD (RLUSD) crosses the $1 billion milestone?
XRP Price Drops as RLUSD Growth Continues
The Ripple price has plunged over the past few months amid the ongoing crypto crash, which has affected Bitcoin and most altcoins.
Still, XRP has several notable bullish catalysts that could boost its performance. One of them is the ongoing growth of stablecoin, which has pushed Ripple USD (RLUSD)’s market cap to over $1 billion.
Data compiled by CoinGecko shows that the RLUSD market cap has jumped to over $1.02 billion, nearly a year after its launch. This growth makes it one of the fastest-growing stablecoins in the network.
READ MORE: Algorand Price Prediction as Transactions, Active Addresses Surge
RLUSD is growing in other areas, including the rising addresses and volume. Its adjusted volume in the last 30 days stood at over $4.1 billion, a 22.7% monthly increase.
Most importantly, the amount of RLUSD stablecoin on the XRP Ledger continues to rise. It has jumped by over 43% in the last 30 days to over $306 million, with the rest being on Ethereum.
XRP price has other bullish catalysts that may boost its performance once the ongoing crash ends. One of them is the real possibility that Bitwise’s XRP spot ETF will be launched next week.
Such a move will boost demand for XRP, as other XRP funds have done. For example, the recently launched XRPR ETF has accumulated over $120 million in assets.
Ripple Price Technical Analysis
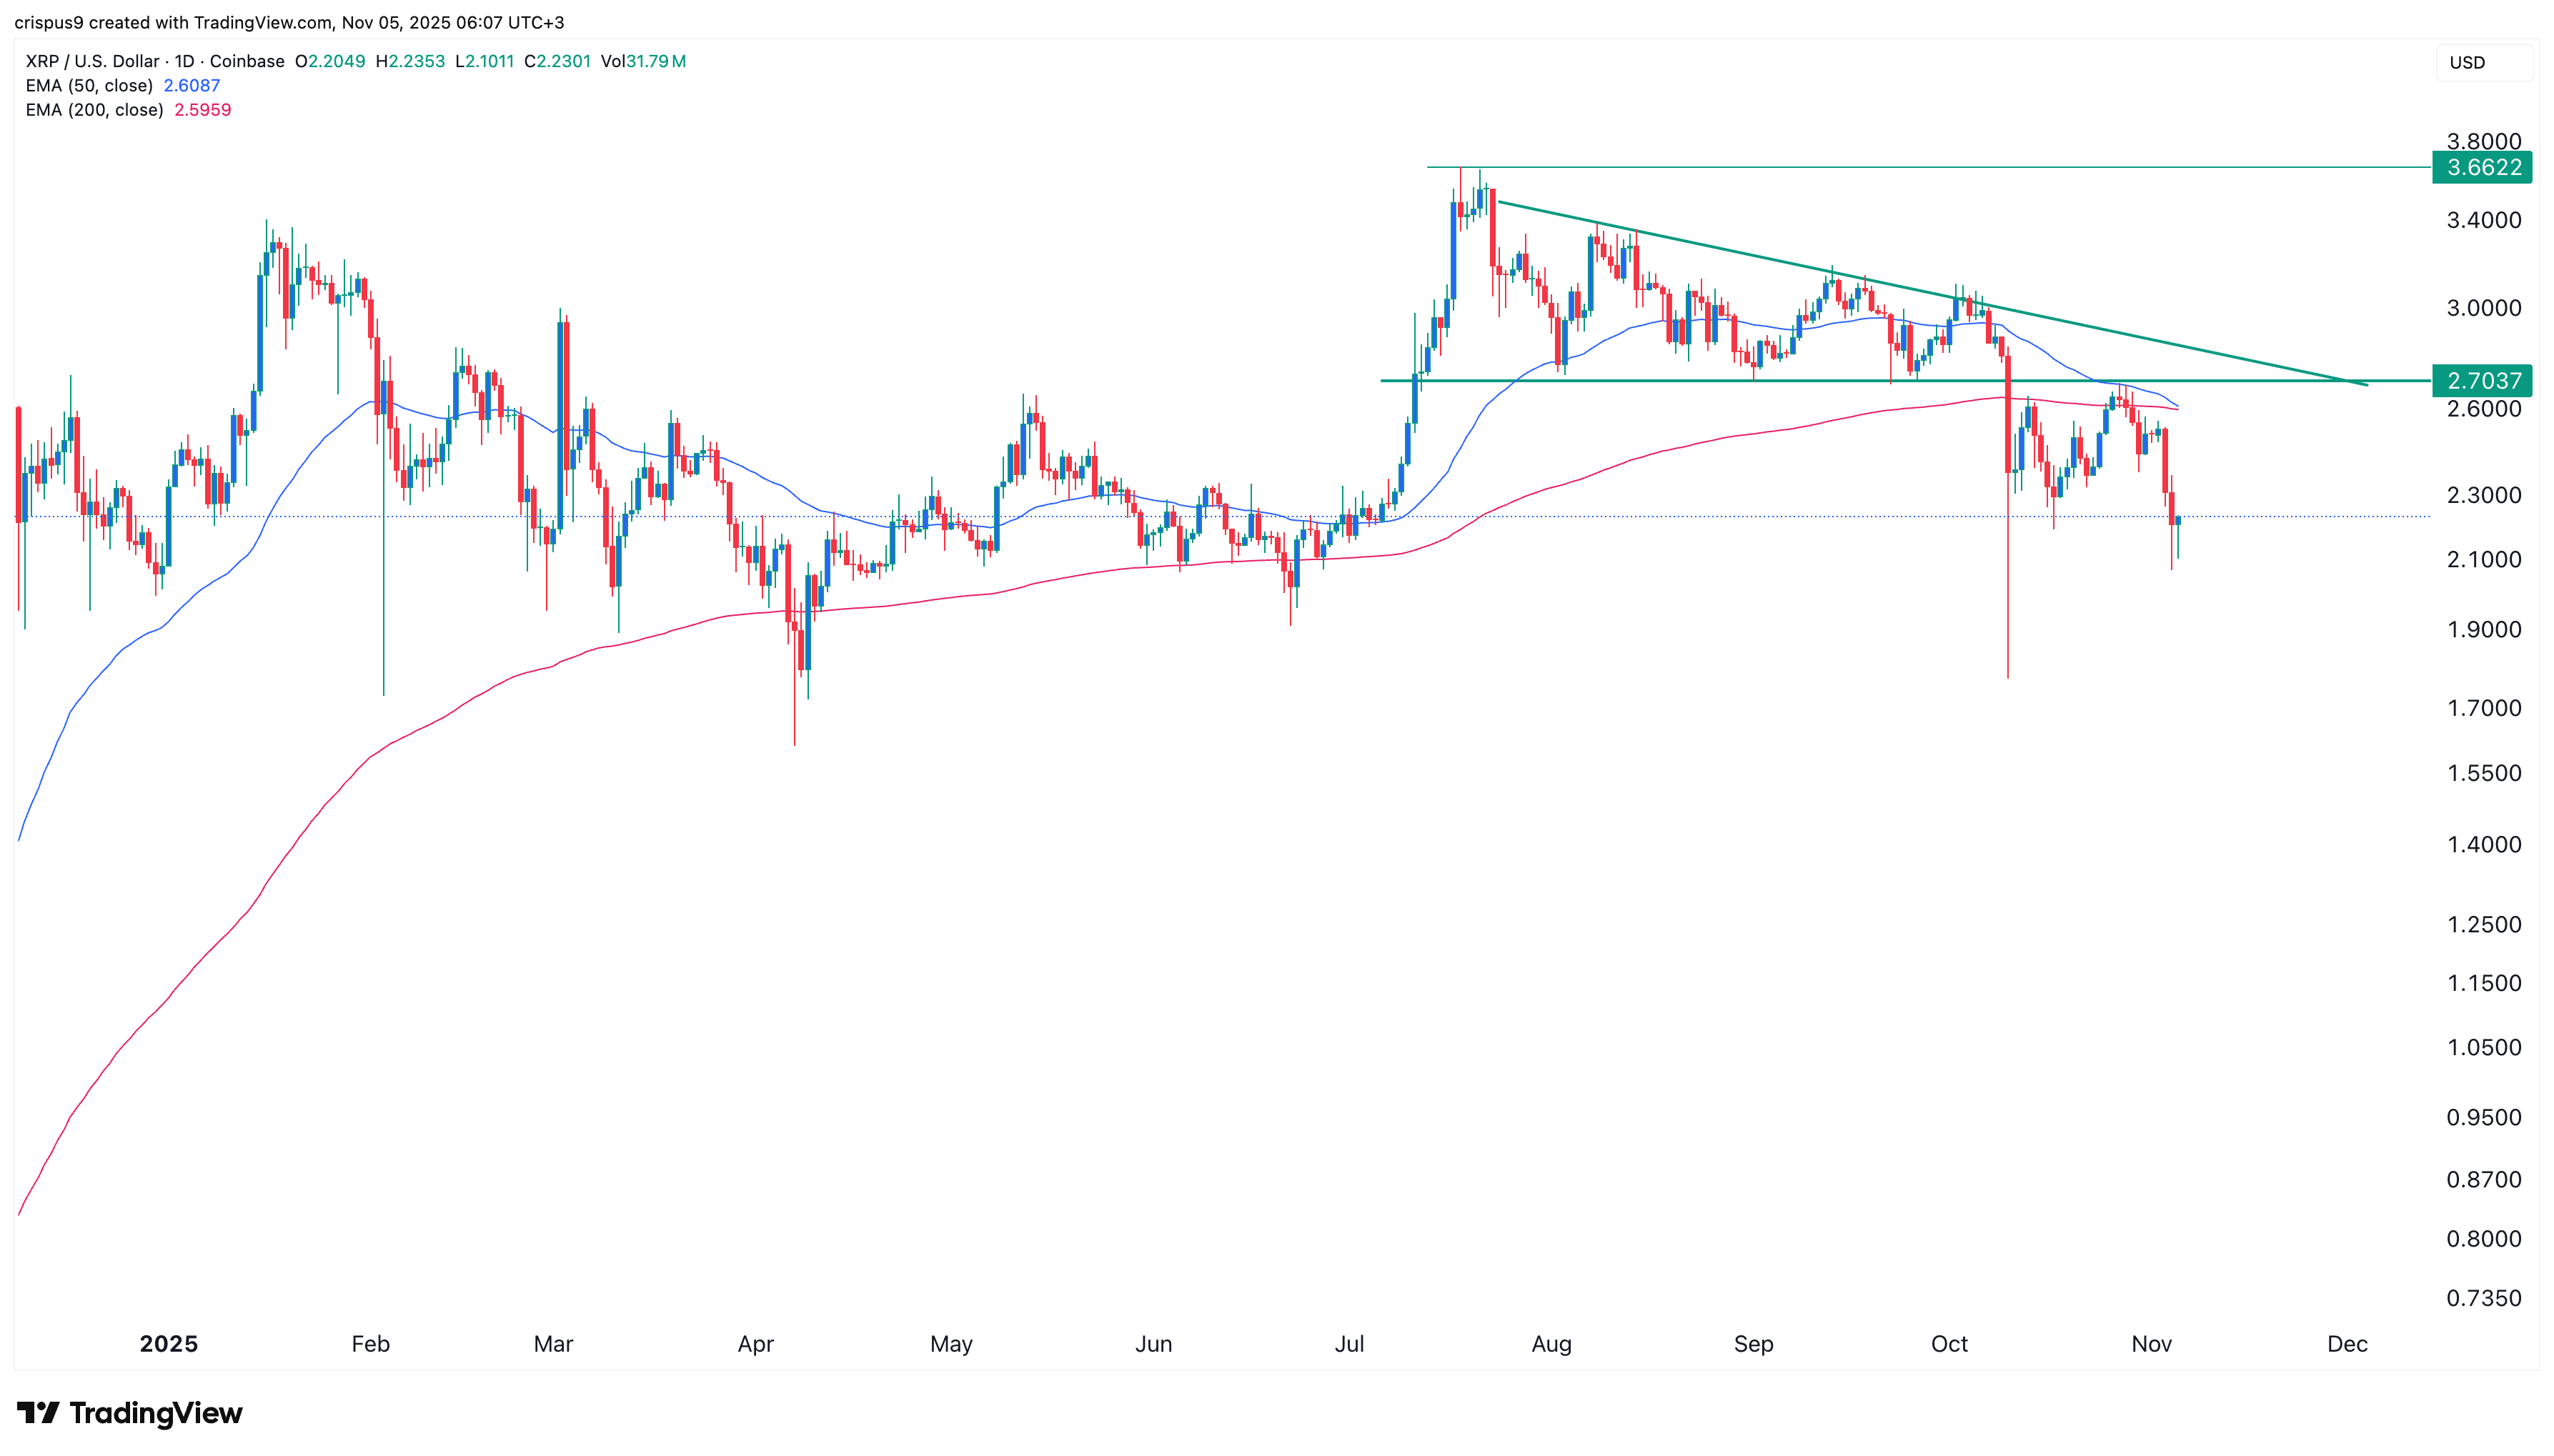
The daily timeframe chart shows that the XRP price has crashed over the past few months, and technical indicators point to further downside in the near term.
First, the coin has retested the important resistance level at $2.7, the lower side of the descending triangle pattern. A break-and-retest is one of the most common continuation patterns in technical analysis.
The second factor is that the coin is about to form a death cross pattern. Data shows that the 50-day moving average is at $2.60, while the 200-day EMA is at $2.5960.
Therefore, the token may remain under pressure this week before bouncing back later this month. The key target to watch will be at $2, down slightly from the current level.
READ MORE: Here’s Why Robinhood Stock Price May Plunge After Earnings