


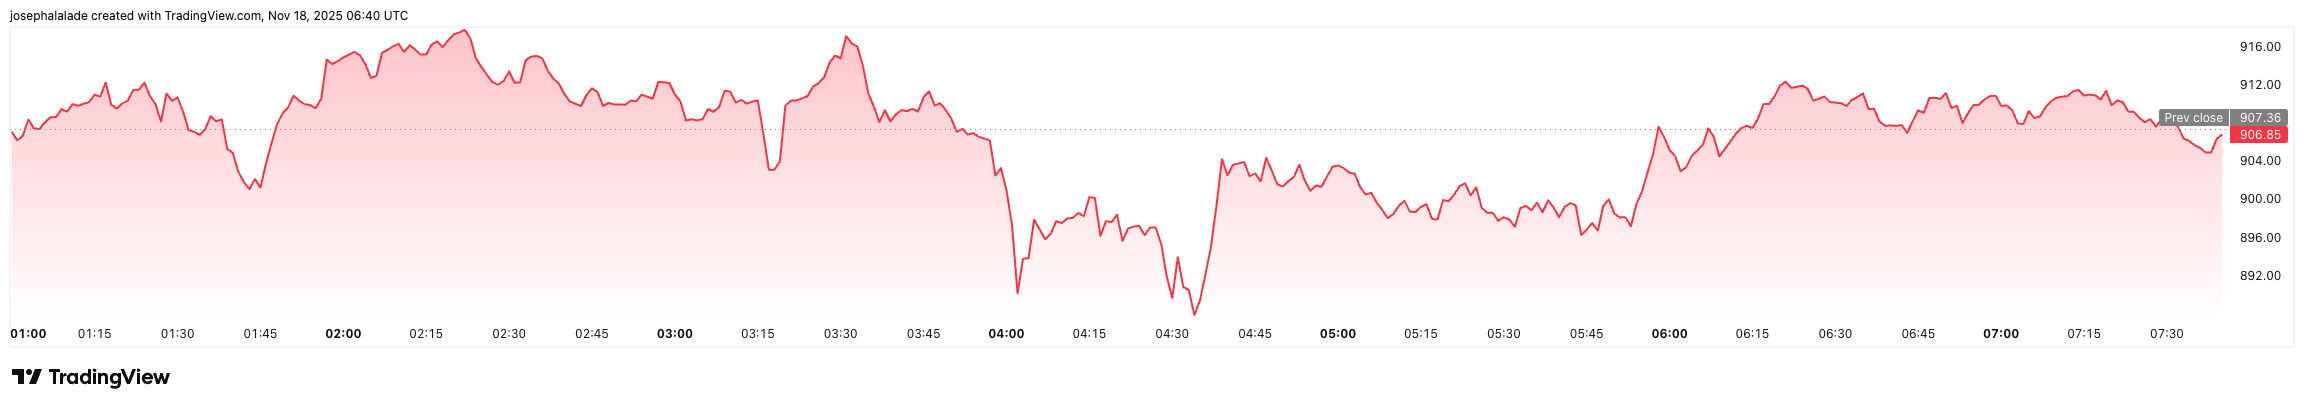
BNB Coin struggled to hold the $900–$925 area today as the broader market continued to unwind aggressive leverage. The BNB price hovered around $908, down roughly 2.6% on the day, while charts reflected the same choppy, pressure-heavy structure seen across major altcoins.
The move mirrors the Bitcoin crash below $90,000 today, which wiped out more than $130 million in long positions within an hour and dragged the total crypto market cap down to roughly $3 trillion, a $1 trillion decline from recent highs.
Market Pullback Deepens as Liquidations Hit BNB Price
BNB didn’t sell off in isolation. Since October 6, the crypto market has shed an estimated $27 billion per day, with highly leveraged traders (50x–100x) increasing the odds of cascading liquidations.
With BNB coin tightly correlated to Bitcoin throughout this cycle, the unwind hit it just as derivatives data turned sour. Open interest across BNB perpetuals dropped nearly 19% this month, signaling fast-exiting speculators. Meanwhile, funding flipped to -0.0019%, confirming that short-side pressure has become the dominant force in the current BNB to USD trend.
On spot charts, BNB briefly dipped to $888.51, marking the lowest level of the past 24 hours and coming within striking distance of the broader market’s key demand pockets.
TradingView data shows a series of weak bounces through the Asian session, with each recovery capped below the short-term moving averages, particularly the 30MA and 50MA, which are both pointing down alongside Bitcoin’s price slide.
Analysts Highlight Bullish Divergence If $880 Holds
Crypto trader Cryptorphic argued that BNB is still holding a structurally important support area at $900–$925, even as the price stayed flat. He pointed out that the RSI continues to print higher lows, a classic bullish divergence, despite the market’s heavy red candles.
In his words, the BNB price is sitting on a key demand zone, and although the price looks heavy, momentum indicators are quietly improving. A breakout above the local trendline could flip momentum back to the upside.
His invalidation level, however, is that a decisive break below $880 would “weaken the structure,” leaving room for a deeper sweep.
On-chain data from Santiment shows why traders are still cautiously watching this setup. While the intraday volatility has been violent, BNB’s 200MA remains the real line in the sand, lagging above price but flattening. Short-term MAs clustering under the 200MA hint at compression, not a full trend collapse, especially if Bitcoin steadies.
But the downside risk is still real. With Bitcoin price already slipping below the $90K shelf, the level traders had marked as the new battleground, BNB Coin almost certainly gets dragged lower.
READ MORE: Cardano Price Slides After $6.2M Whale Error, ADA Eyes $0.30 Next