


Chainlink price has rebounded this week, supported by ongoing demand for its first exchange-traded fund (ETF) and notable partnerships. LINK has also soared amid whale buying, falling exchange balances, and the formation of a falling wedge pattern.
Chainlink Price Rises as LINK ETF Demand Rises
The LINK price has staged a strong recovery in the past few days, moving from a low of $11.56 to the current $14.30. This rebound followed Grayscale’s launch of its first LINK ETF, which market participants received well.
Data shows that the GLNK ETF has accumulated over $40 million in inflows since its launch earlier this week. It now holds over $67 million in assets, a trend that will likely continue in the coming months.
The LINK ETF is seeing strong demand because of Chainlink’s fundamentals. It has grown to become one of the most prominent players in the real-world asset (RWA) tokenization industry. For example, the company just announced a deal to provide solutions during the tokenization of Figure’s home equity loan platform.
READ MORE: Top Catalysts that May Boost the Pi Network Price in December
Chainlink is also a major player in the decentralized finance (DeFi) industry, providing oracle solutions to the biggest players.
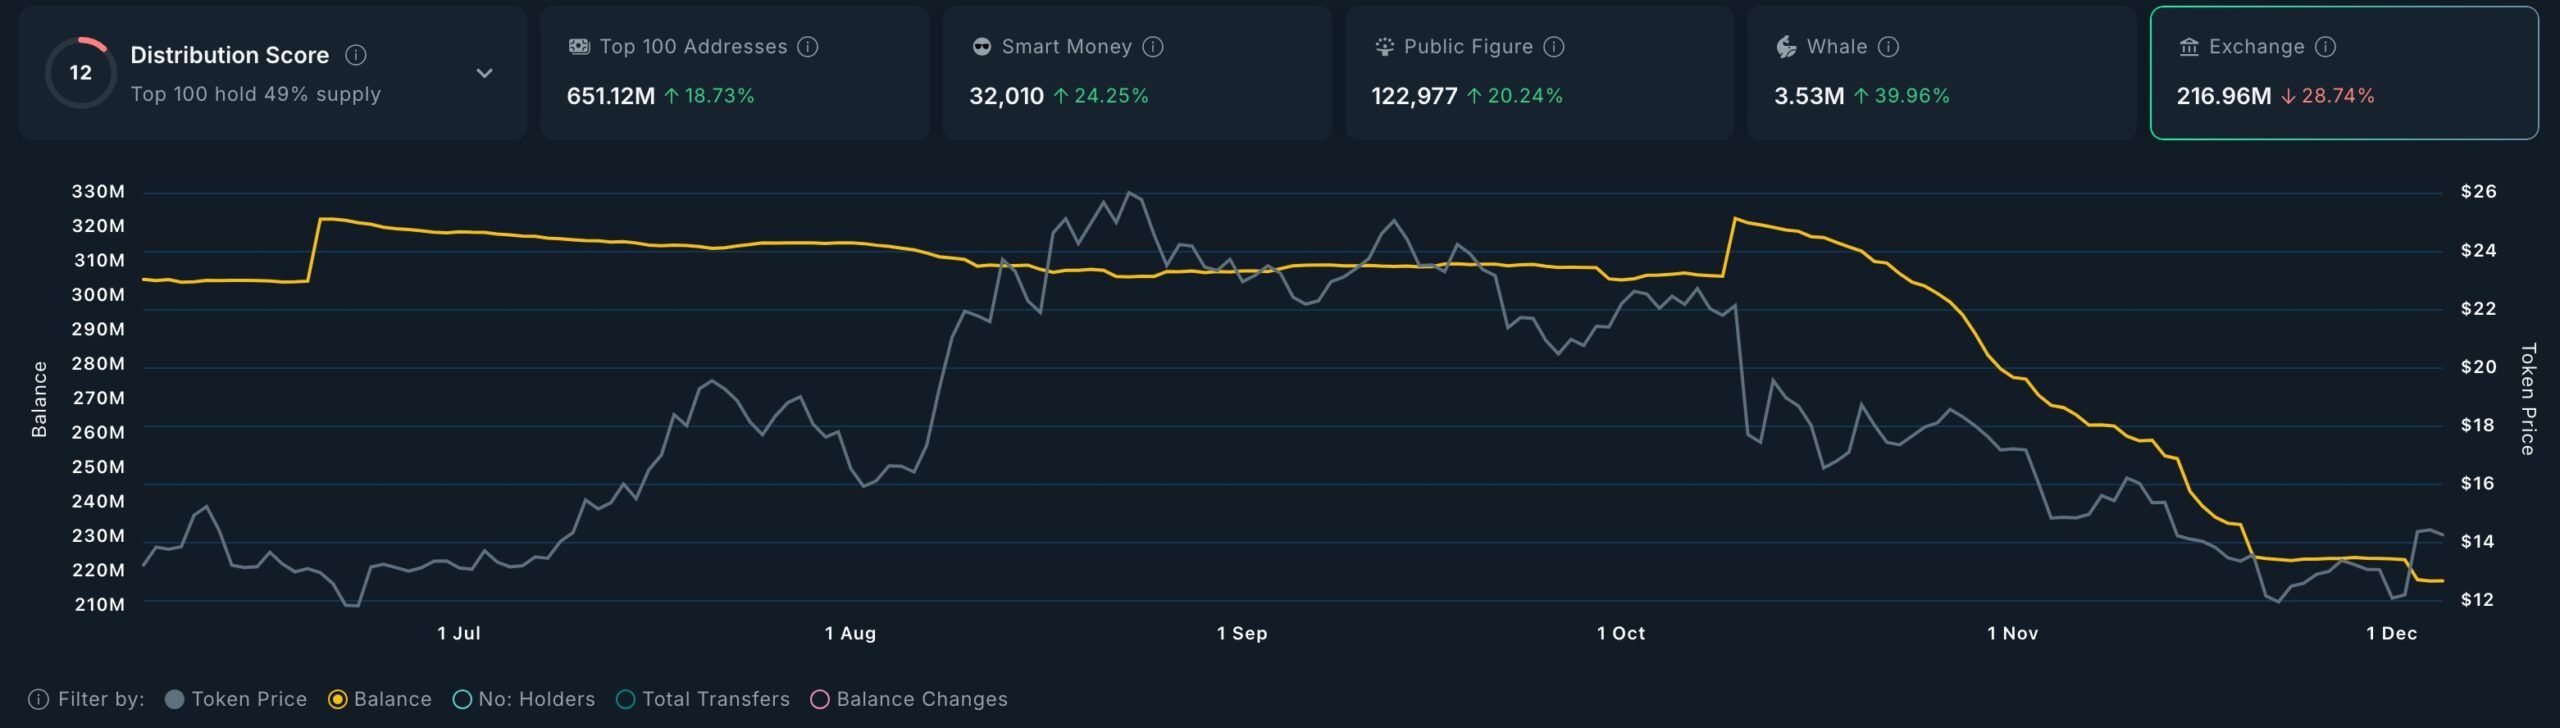
Meanwhile, on-chain data show that demand for the LINK token has remained elevated. Whales have continued to accumulate the token and now hold over 3.5 million tokens.
The supply of LINK tokens on exchanges has dropped by 30% in the last 30 days to 217 million. A decline in exchange balances is a good thing as it shows that investors are buying their tokens.
One entity that has continued buying the LINK tokens is Chainlink itself. It has accumulated tokens worth over $14 million as part of its Strategic LINK Reserves. This growth will continue as Chainlink’s use continues.
LINK Price Technical Analysis
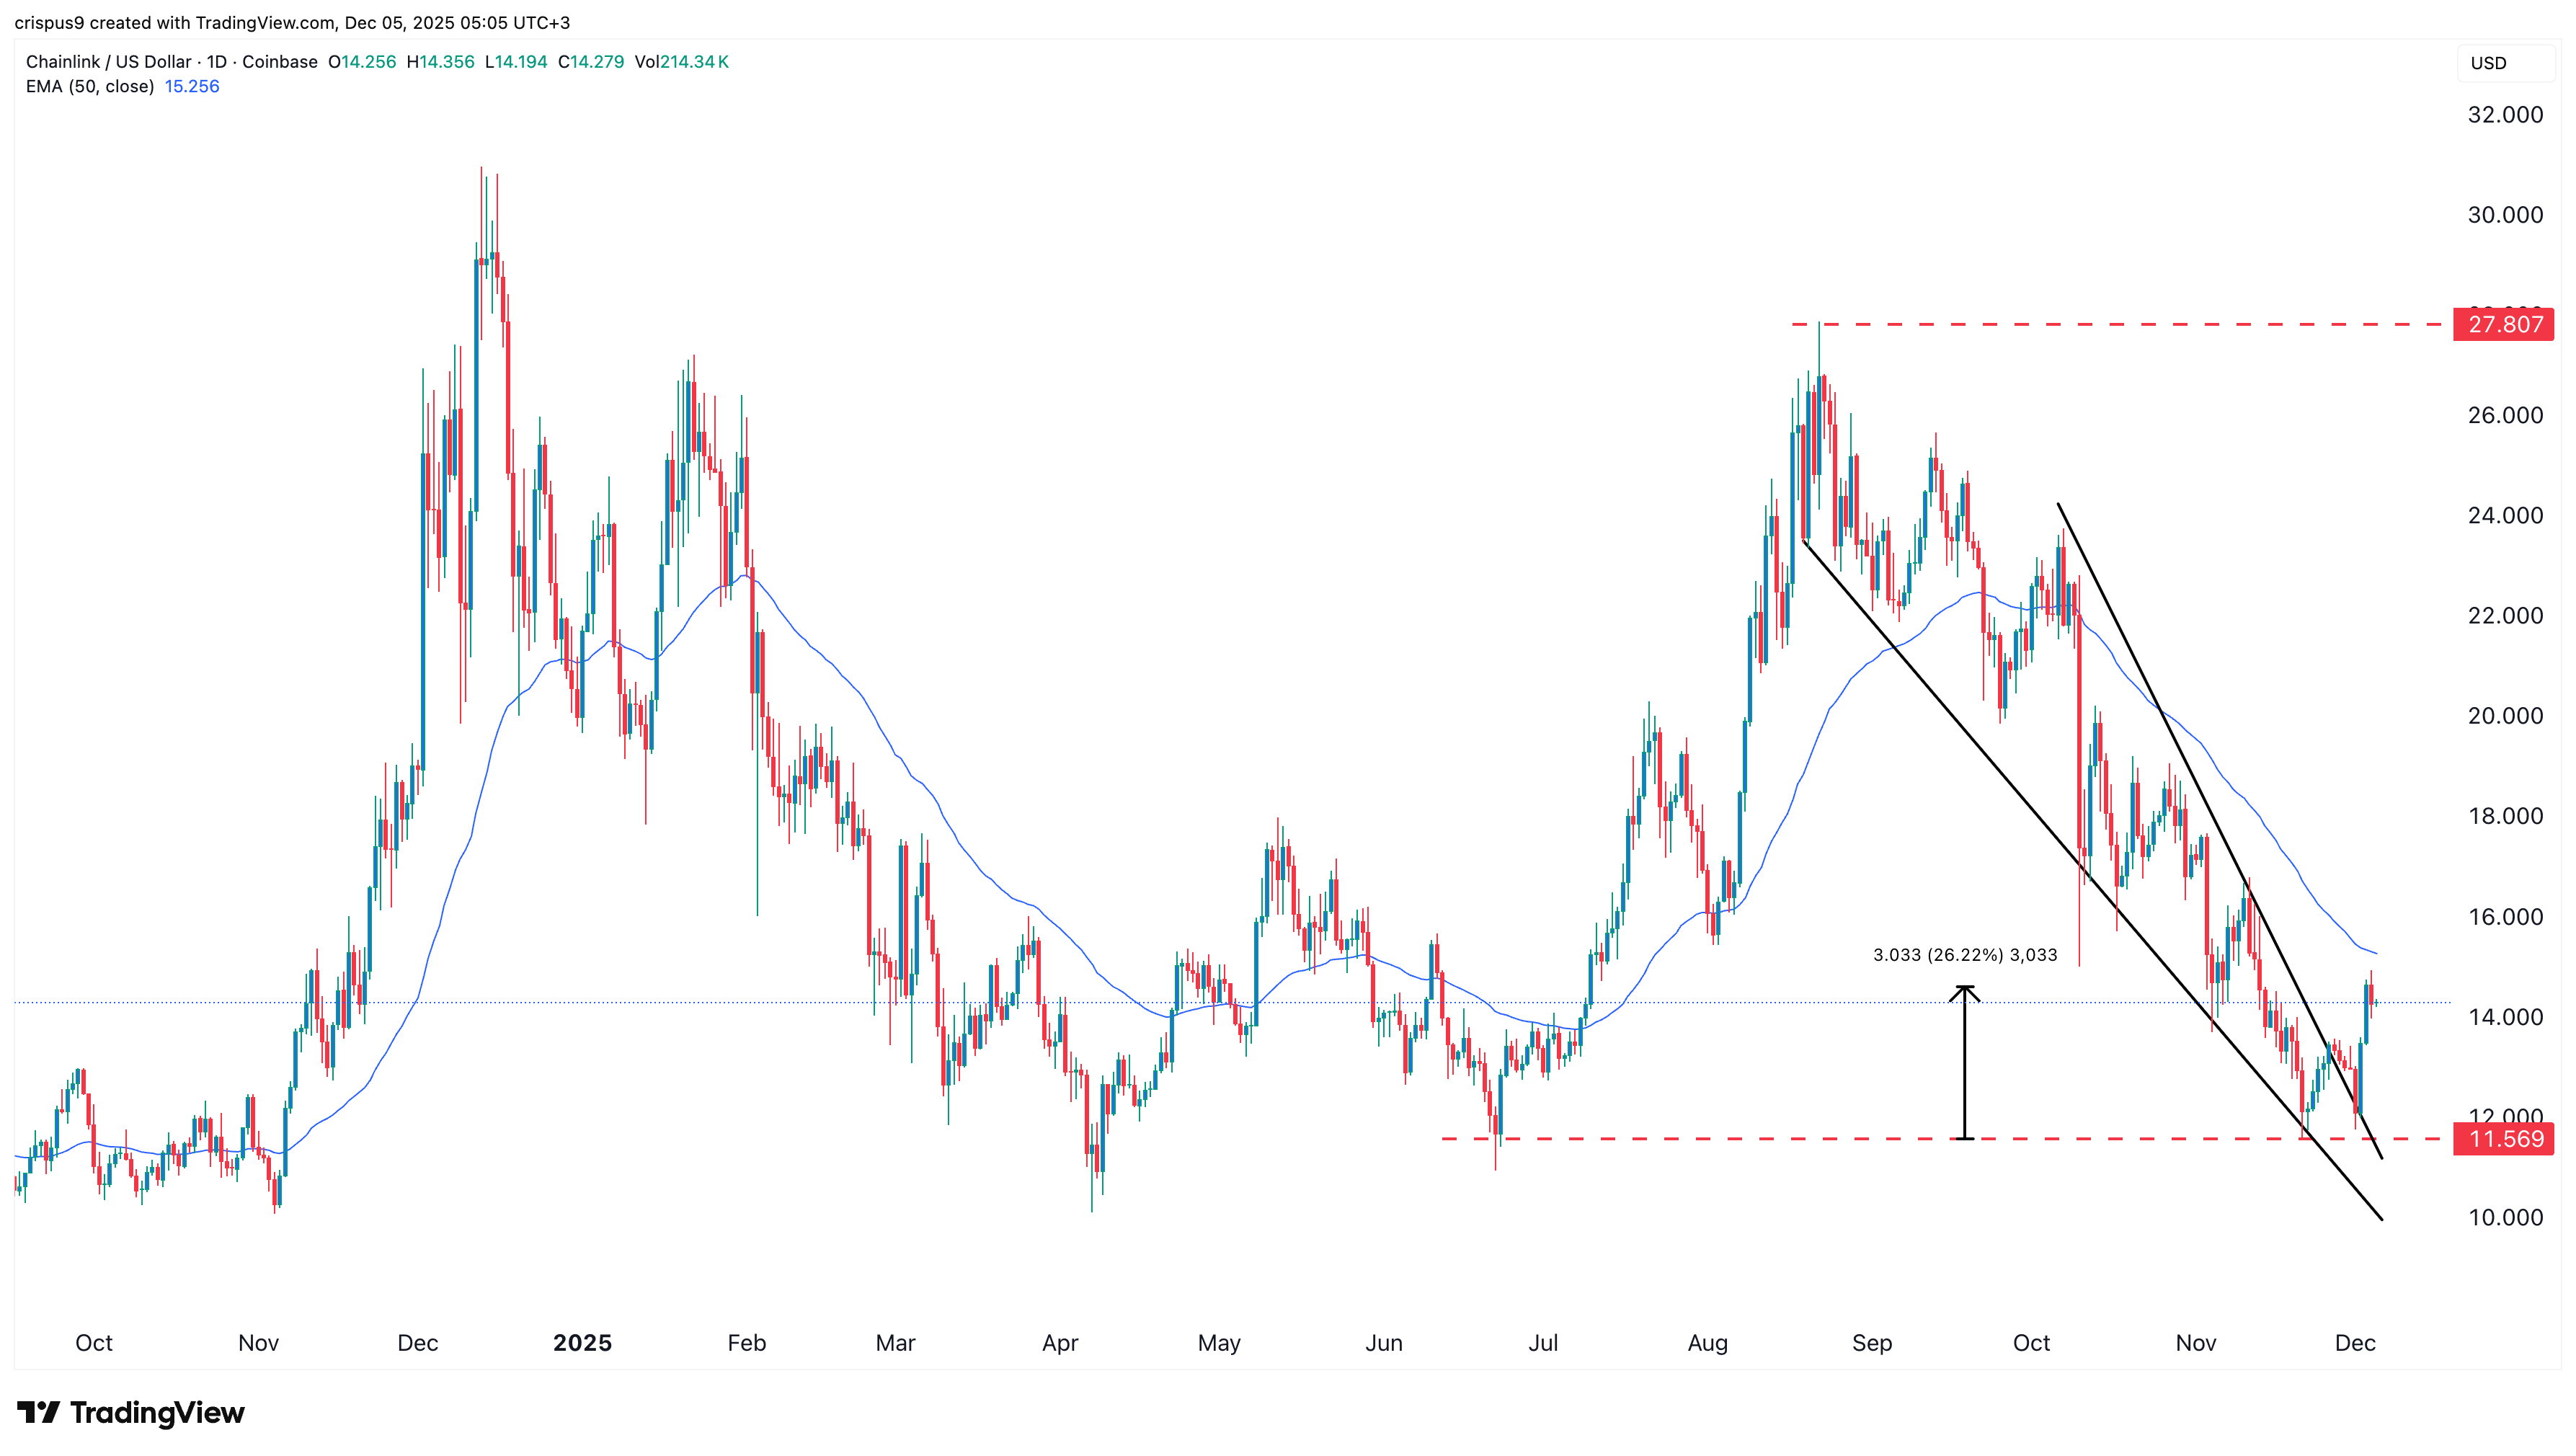
The daily chart shows that LINK bottomed at $11.56 and has since rebounded to $14.25. This rebound happened as the token formed a giant falling wedge pattern, one of the most common bullish reversal signs.
It also formed a giant double-bottom pattern at $11.56, its lowest point in June and November. Therefore, the most likely scenario is where the token rebounds and hits the critical resistance level at $20. This outlook will become invalid if it falls below $11.56.
READ MORE: Ethereum Price Prediction After Fusaka Upgrade as TPS Soars