


The XRP price is slowly showing signs of bottoming after falling by over 40% from its July high. Ripple token was trading at $1.9235, a few points above the crucial support level at $1.8140.
Brad Garlinghouse Celebrated a Key XRP ETT Milestone
Spot XRP ETFs have had a major milestone since they were launched 30 days ago, a move that Brad Garlinghouse, the head of Ripple Labs, celebrated in a social media post.
Garlinghouse was reacting to a Coindesk podcast post noting that these funds have seen substantial inflows since their launch, outperforming Bitcoin and Ethereum.
Data compiled by SoSoValue shows that XRP ETFs have had over $1.01 billion in inflows since their inception. These inflows have pushed their total assets to $1.16 billion.
READ MORE: Top Reasons Why Pi Network Flopped in 2025
The Canary XRP ETF is still benefiting from its first-mover advantage, as it holds the largest asset base. It has accumulated $330 million in assets.
However, the recently launched 21Shares XRP ETF is catching up with it as its assets have jumped to $231 million in less than a week. Grayscale and Bitwise XRP ETFs have all accumulated over $200 million in assets, while the Franklin Templeton fund has $180 million.
In contrast, Bitcoin and Ethereum ETFs have seen significant outflows over the past few months as their retreats continued.
Most importantly, data show that XRP ETFs have more room to go, as their current assets represent only 0.98% of their market capitalization. In contrast, the ratio of Bitcoin and Ethereum to their assets has jumped to over 5%.
XRP ETFs have likely attracted assets due to numerous catalysts, including the award of a bank license by the Office of the Comptroller of the Currency (OCC), the growth of the RLUSD stablecoin, and the recent investment by Citadel at a $40 billion valuation.
XRP Price Technical Analysis
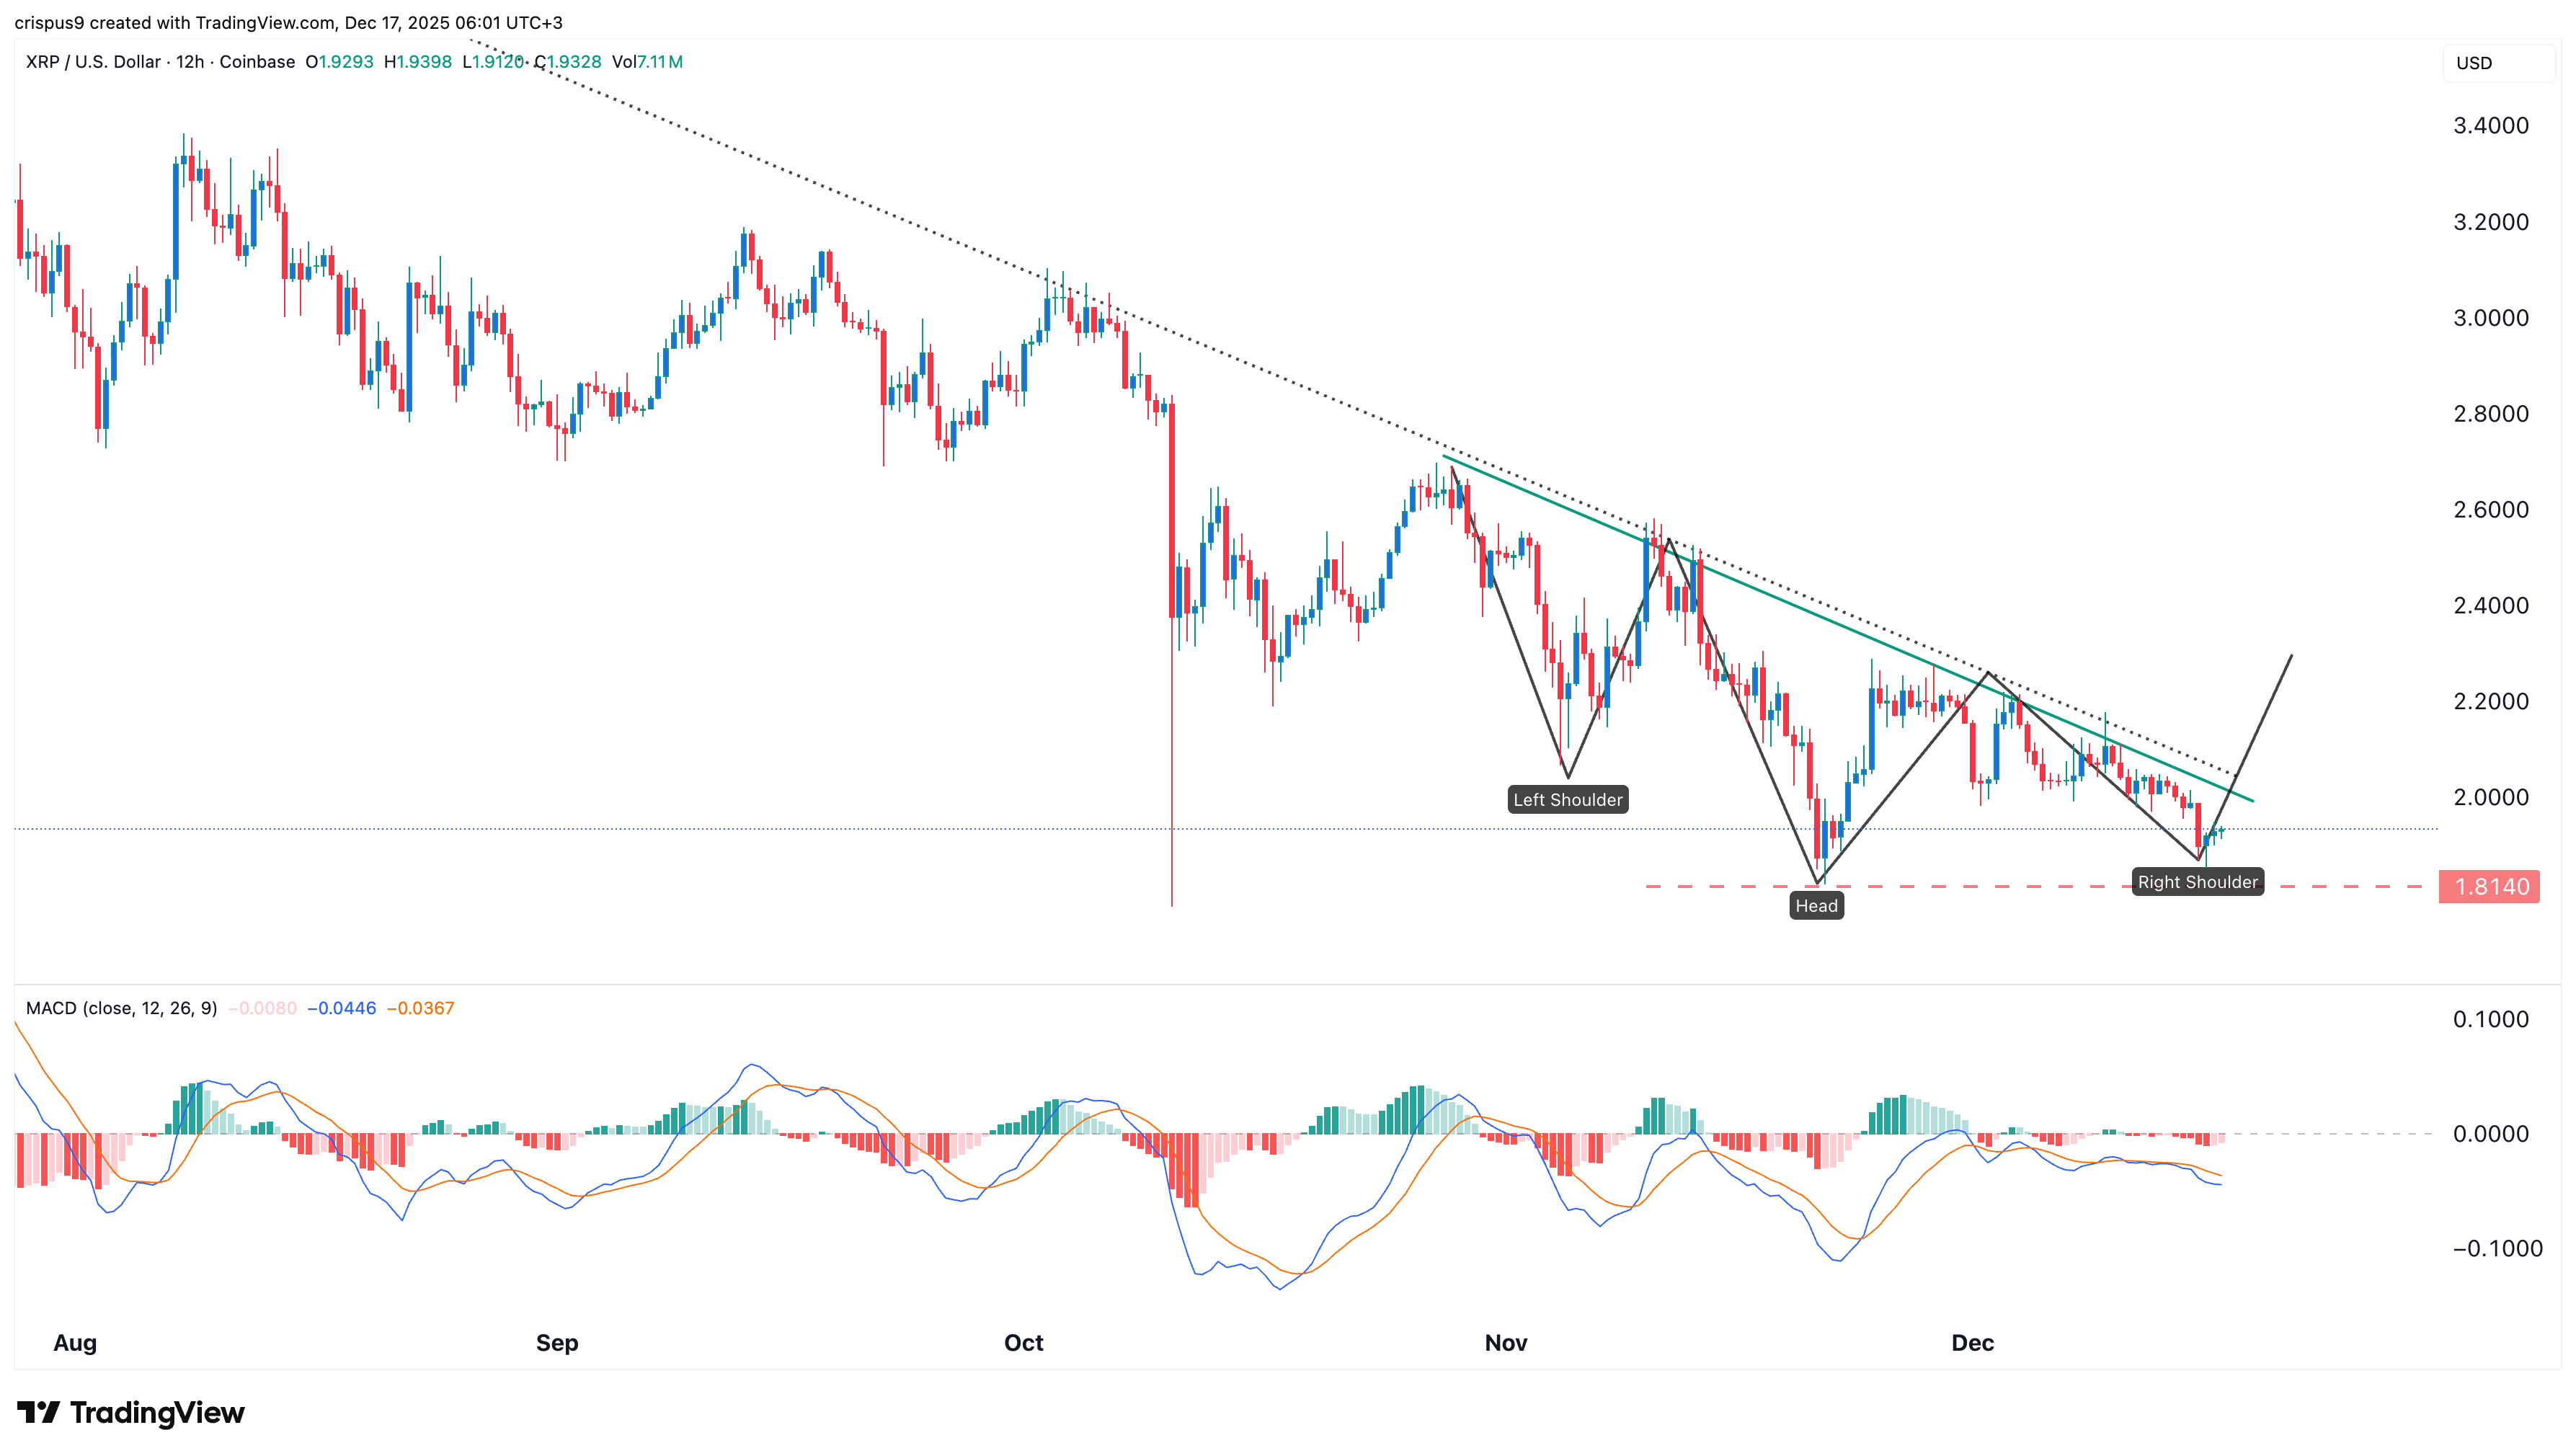
The 12-hour chart shows that the XRP price may be on the cusp of a strong bullish breakout. It has settled slightly above the critical support level at $1.8140, where it has formed a double-bottom pattern.
XRP has also formed an inverted head-and-shoulders pattern, which is a common bullish reversal sign. Its neckline is defined by the descending trendline connecting the highest swings since October 28.
The coin has also formed a bullish divergence as the MACD indicator has moved upwards. Therefore, the most likely scenario is where the coin rebounds in the coming weeks. Such a move will push it to the next key resistance level at $2.5. A move above $2.5 will point to more gains, potentially to $3.
However, a drop below the key support $1.8140 will invalidate the bullish XRP price forecast.
READ MORE: Solana Price May Crash to $100 Despite ETF Inflows and Strong Network Growth