


Ethereum price has already crashed by double digits in the past few months, and technicals suggest that it has more downside to go. This article conducts a multi-timeframe analysis and explains what to expect in the coming weeks.
Ethereum Price Daily Timeframe Analysis
The daily timeframe chart shows that the ETH price has been in a strong downtrend in the past few months. A closer look at this chart shows that it has formed numerous risky patterns that may lead to more downside in the near term.
Ethereum price is now forming a bearish flag pattern, which consists of a vertical line and a channel. It is now forming the flag section, which will lead to more downside.
The coin has also remained below all moving averages, the Parabolic SAR, Ichimoku cloud, and the Supertrend indicators. All of these are risky chart patterns that will likely lead to further downside.
It is also between the 50% and the 61.8% Fibonacci Retracement levels. A move below the latter level will confirm the bearish breakout, potentially to the psychological $2,000 level, which is about 30% below the current level.
READ MORE: Pi Network Price Forms Risky Pattern as Demand Dries
On the flip side, a move above the flag’s upper side will invalidate the bearish ETH price forecast and point to further downside.

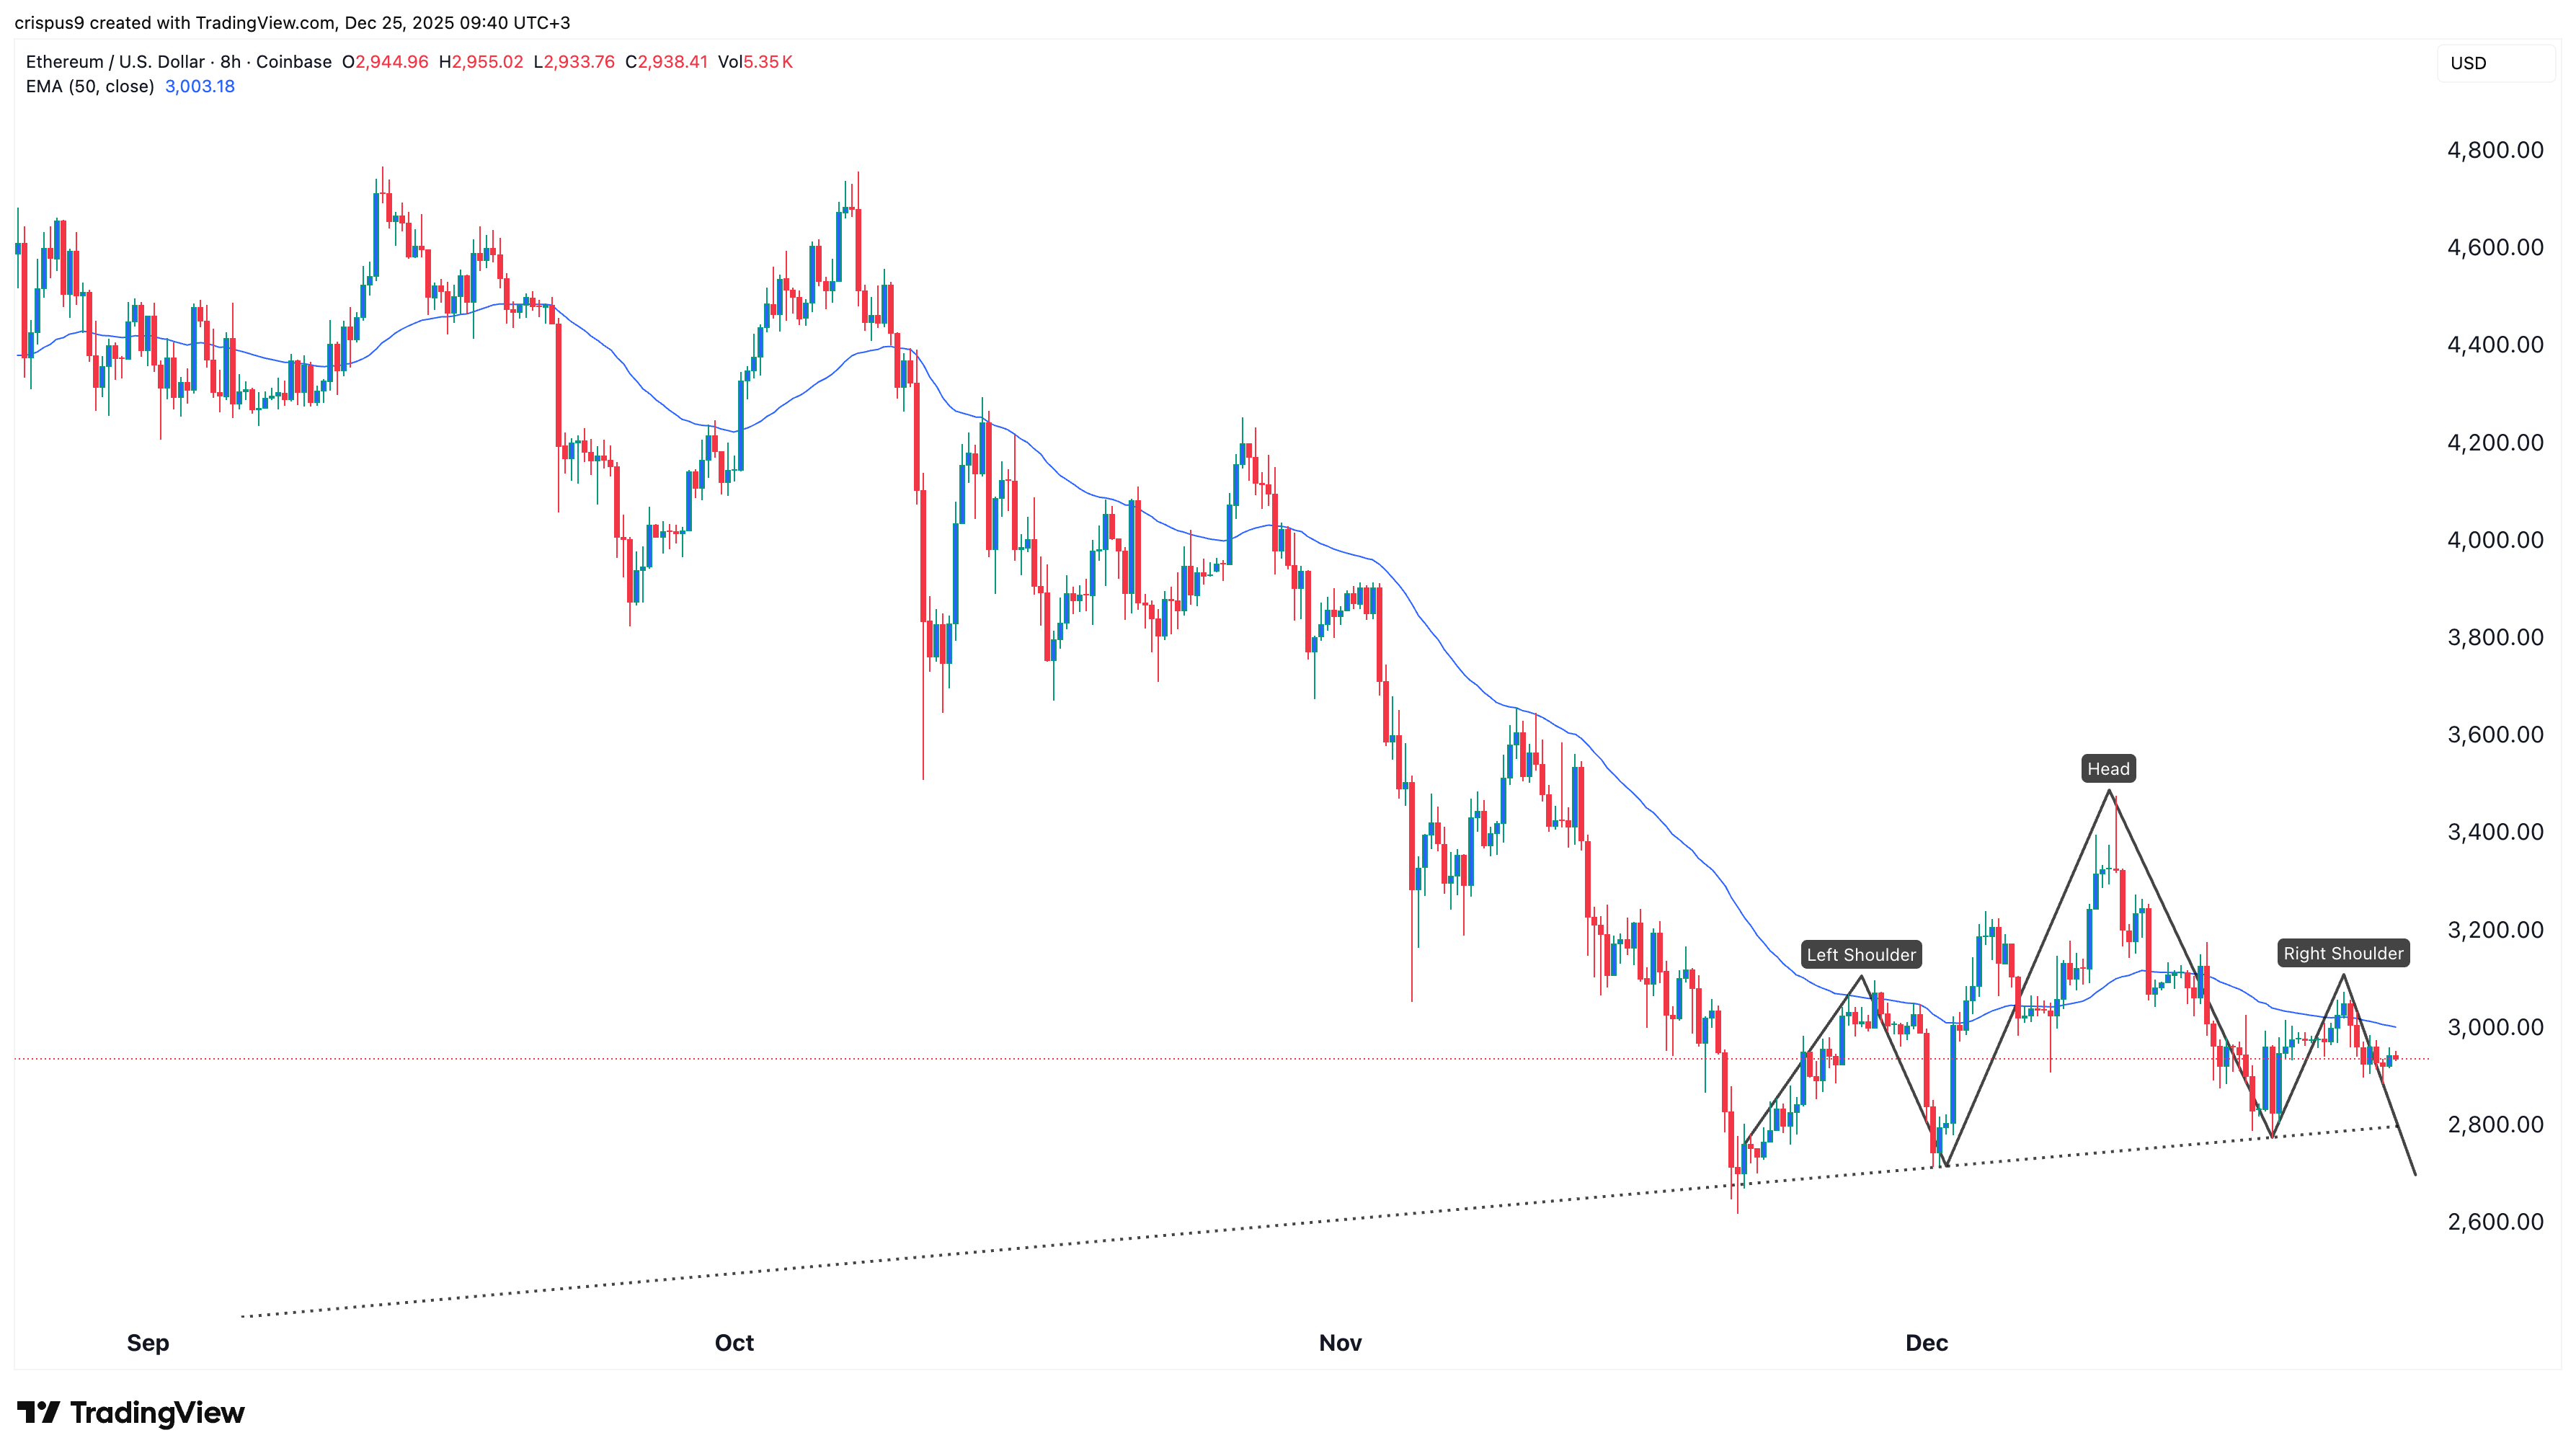
ETH Price Eight-Hour Chart Analysis
The eight-hour chart also points to more downside. As shown in the chart above, the ETH price has remained below all moving averages. Most importantly, however, is that it has slowly formed a head-and-shoulders pattern.
A H&S pattern is one of the riskiest signs in technical analysis. It is now forming the right shoulder section. Therefore, the most likely scenario is where it breaks down in the near term now that the Santa Claus rally has stalled.
Long-Term ETH Outlook is Bullish
Ethereum’s short-term technical outlook is highly bearish. However, its long-term outlook is bullish, especially given its strong fundamentals.
Ethereum has become a giant in the crypto industry, controlling all areas. For example, while many layer-1 and layer-2 chains launched this year, Ethereum has maintained its domination.
A good example of this is in the decentralized finance (DeFi) industry, where its market dominance has jumped to over 70%. Keep in mind that this is an industry where other popular chains like Solana, BNB Chain, Tron, and Plasma are in.
The same is happening in other areas. In stablecoins, it has a supply of nearly $170 billion in an industry with $3o8 billion in assets. Similarly, Ethereum has become a large chain in the RWA industry, where it recently welcomed JPMorgan.
These fundamentals explain why Tom Lee is aggressively buying the Ethereum token through BitMine, which aims to hold 5% of the market cap. It also explains why the supply of ETH on exchanges has continued to fall this year.
READ MORE: Cardano Price Prediction 2026: Top 5 Catalysts for ADA Token