


XRP price has dropped into a deep bear market, mirroring the performance of Bitcoin and other altcoins. It remains below the key $2 support level and has plummeted by nearly 50% from the year-to-date high of $3.6655. This article explores why Ripple has crashed and what to expect.
XRP Price Crashed Despite Key Good News
XRP price has plunged despite having some notable bullish catalysts this year. First, the SEC vs Ripple case ended earlier this year, allowing the company to accelerate its dealmaking in the United States.
Indeed, the deal helped the company raise $500 million from Citadel and Fortress, two of the biggest companies on Wall Street. It also helped the company acquire four companies, including Hidden Road, GTreasury, Rail, and Palisade.
Meanwhile, the XRP price declined even after the Securities and Exchange Commission (SEC) approved several ETFs that have been well-received by American investors. Data shows that these ETFs have now accumulated over $1.14 billion in inflows, bringing the total assets to over $1.24 billion.
READ MORE: Solana Price Prediction 2026: Risky Pattern Forms Despite Key Catalysts
XRP is the third crypto ETF to reach the $1 billion milestone, after Bitcoin and Ethereum. Its funds are growing at a faster pace than Ethereum’s, meaning they may ultimately surpass it in the coming years.
XRP price also dropped after being launched on CME futures, a move that made it available to large institutional investors. These futures contracts were among the first to cross the $1 billion milestone in futures open interest.
XRP price crashed even as the Ripple USD (RLUSD) stablecoin gained momentum. Data show that the RLUSD stablecoin has crossed $1.385 billion in assets, with $293 million on the XRP Ledger and $1.065 billion on Ethereum.
This growth will likely accelerate in the coming months as it expands to other layer-2 networks like Base, Optimism, and Ink.
Therefore, XRP price crashed this year as investors sold cryptocurrencies, with many rotating to the stock market, silver, and gold. It also dropped as investors reacted to the huge liquidation event that happened on October 10 this year.
Ripple Price Technical Analysis Suggests More Downside Ahead
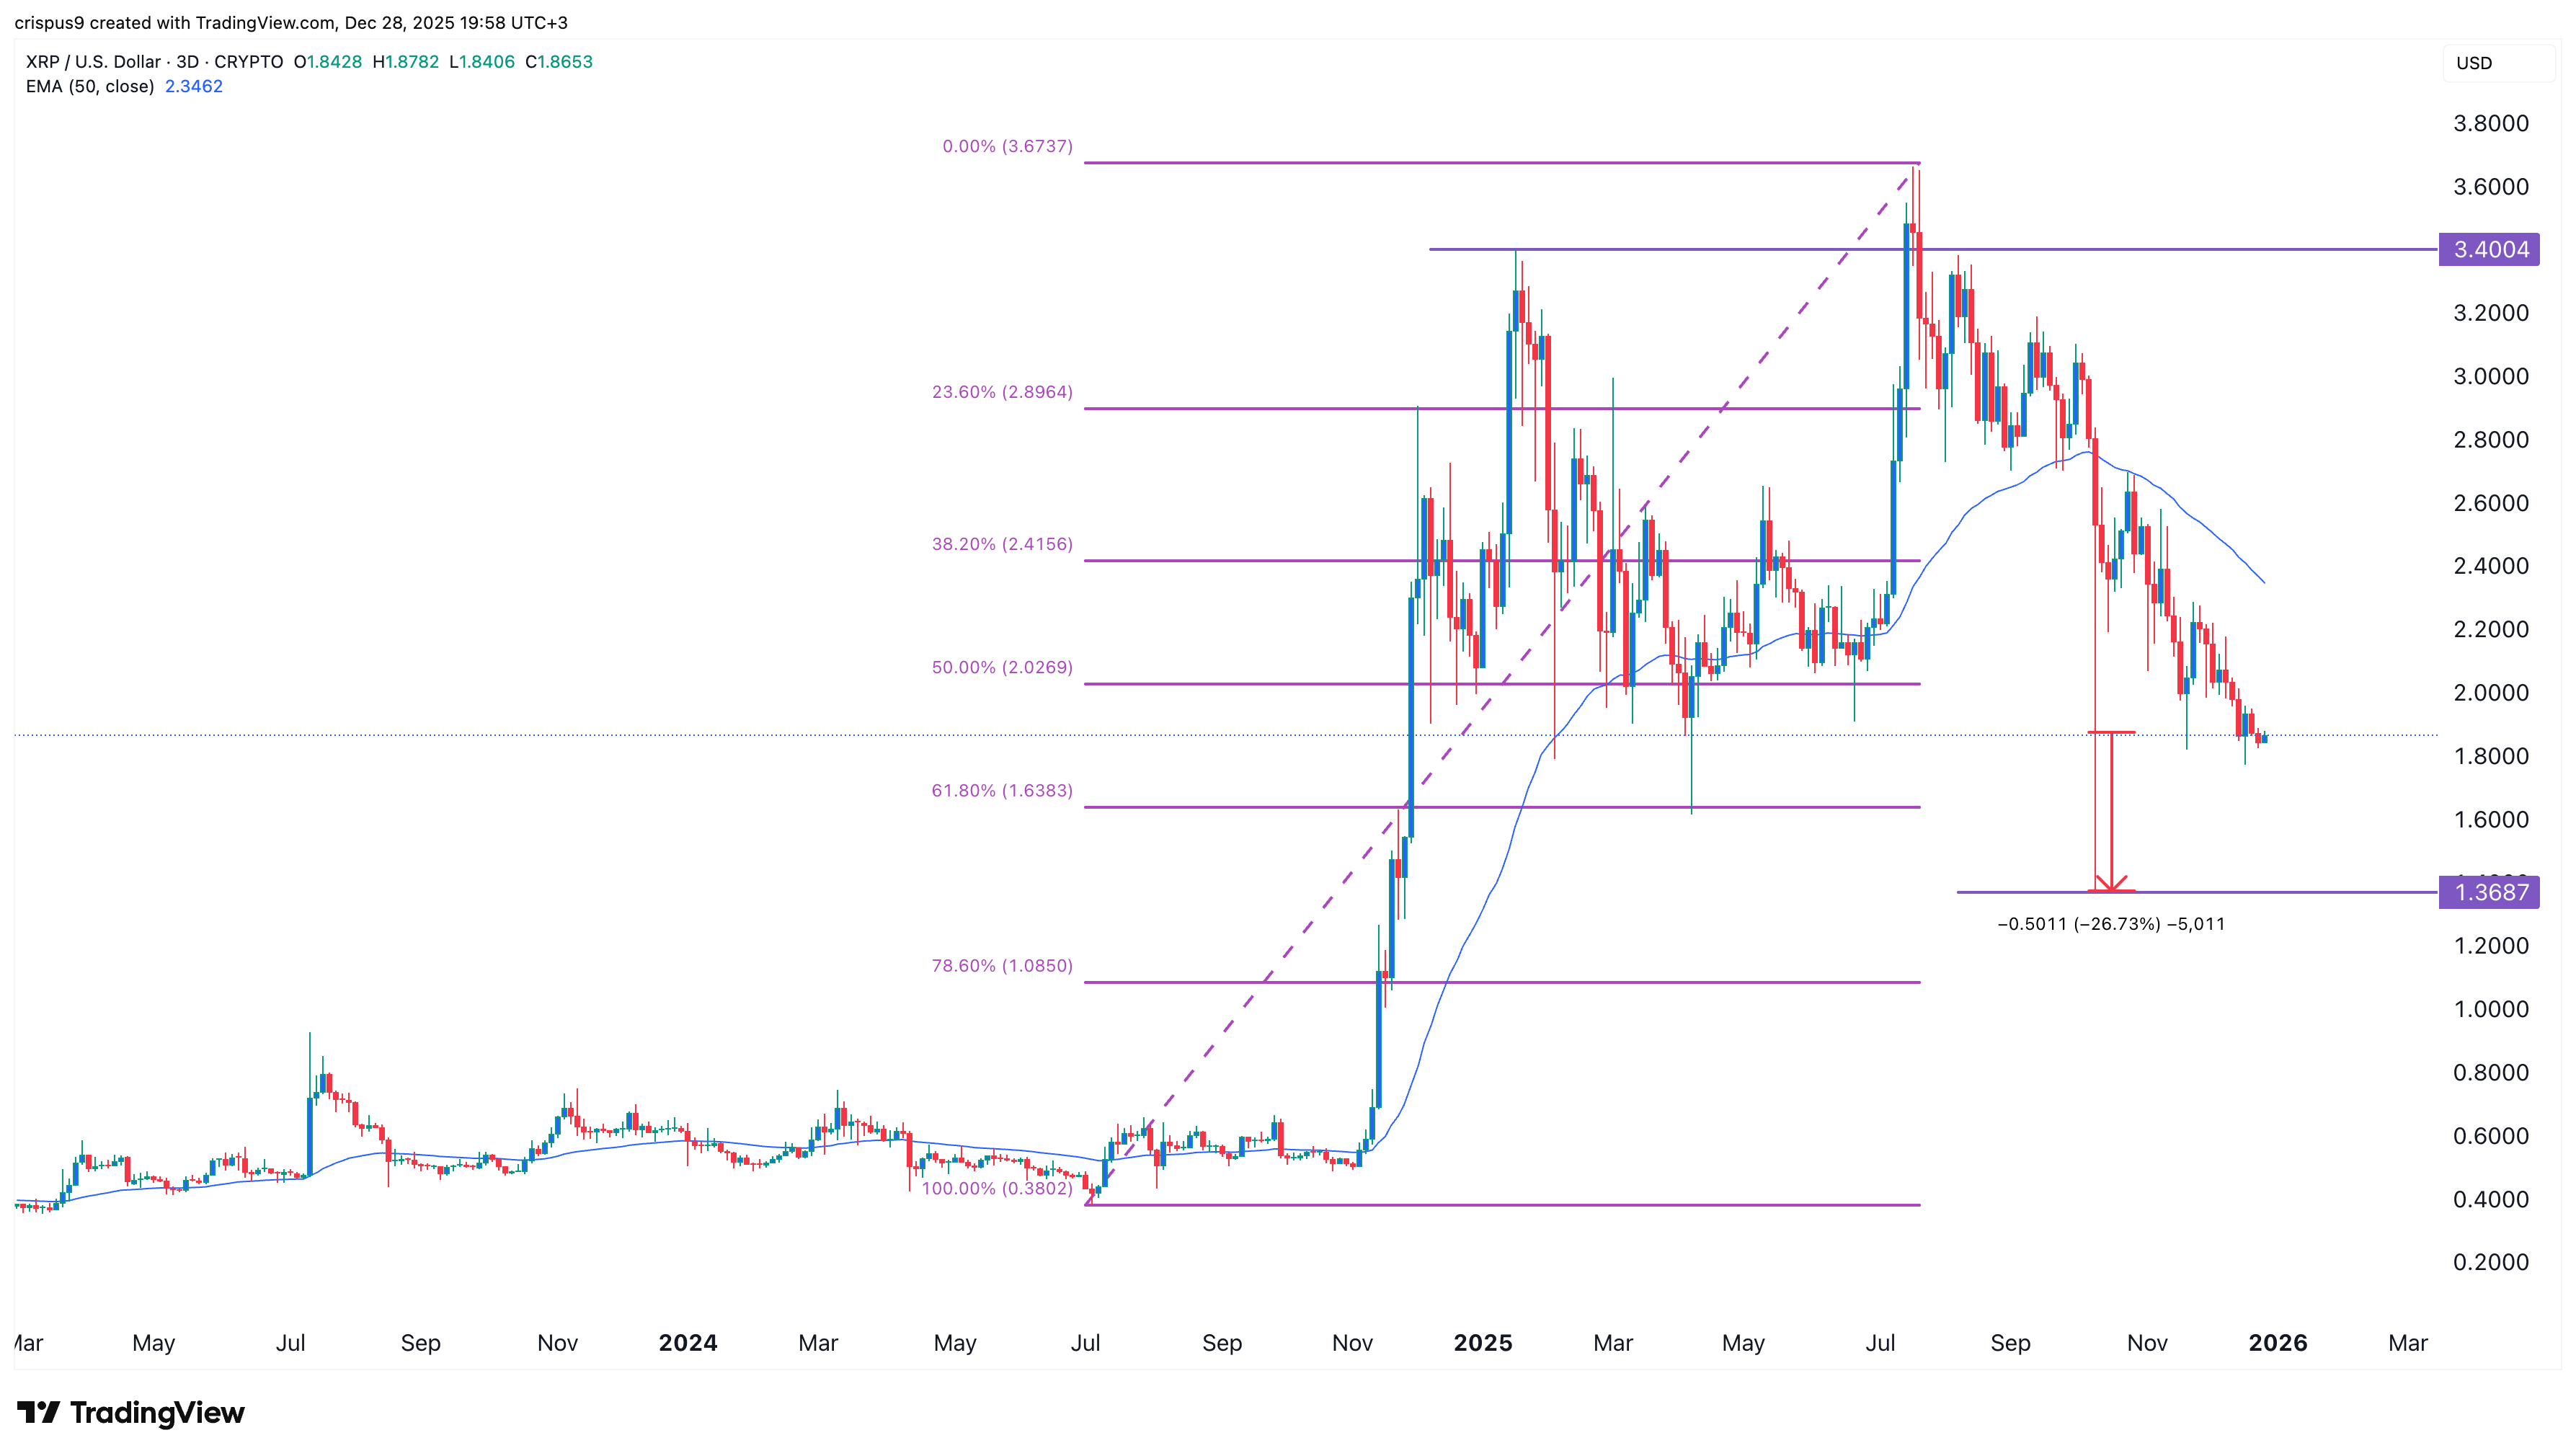
The three-day timeframe chart shows that the XRP price is at risk of more downside in the coming weeks. It has formed a double-top pattern at $3.40 and a neckline at the 61.8% Fibonacci Retracement level at $1.63.
The Ripple token has moved below the 50-week Exponential Moving Average (EMA), while the Relative Strength Index (RSI) and the MACD indicators have continued to fall.
Therefore, the most likely Ripple price forecast is highly bearish, with the next key level to watch being the neckline at $1.6383, about 12% below the current level. A drop below that level will point to more downside to this year’s low of $1.3687, down by 26% from the current level.
READ MORE: Dogecoin Price Crashed 63% in 2025 — What’s Ahead in 2026?