


Chainlink price settled at a crucial support level as the Strategic LINK Reserve made its largest acquisition to date. The LINK token has been trading at $12.48 for the past few days. So, will the token rebound or crash in January?
Strategic LINK Reserve Makes Biggest Buyout
Chainlink price remained in a tight range after the company continued to accumulate LINK tokens. It acquired 94,267 tokens, the biggest purchase since the accumulation strategy started in August last year. It was also much higher than the 89,971 it bought previously.
Chainlink now holds over 1.42 million tokens, worth over $17.7 million, in its reserves, a figure that will continue to rise in the near term. Its average LINK cost basis was $17, much higher than the current $12.50.
Chainlink price will also benefit from inflows into the recently launched spot LINK ETF. Data compiled by SoSoValue shows that the Grayscale LINK ETF has accumulated over $59 million in inflows, bringing its net assets to $73 billion.
READ MORE: MSTR Stock Was the Top Laggard in Nasdaq 100 Index: Will it Rebound in 2026?
The biggest catalyst for Chainlink’s price is that it sits at the intersection of the market’s biggest theme: real-world asset tokenization. It has already inked major deals with the industry’s biggest players, including Euroclear, Swift, UBS, and JPMorgan.
The ongoing on-chain metrics also boost Chainlink. Data show that the supply of LINK tokens on exchanges has continued to fall, a sign of growing accumulation. At the same time, whales and smart money investors have continued accumulating the token.
Chainlink Price Technical Analysis
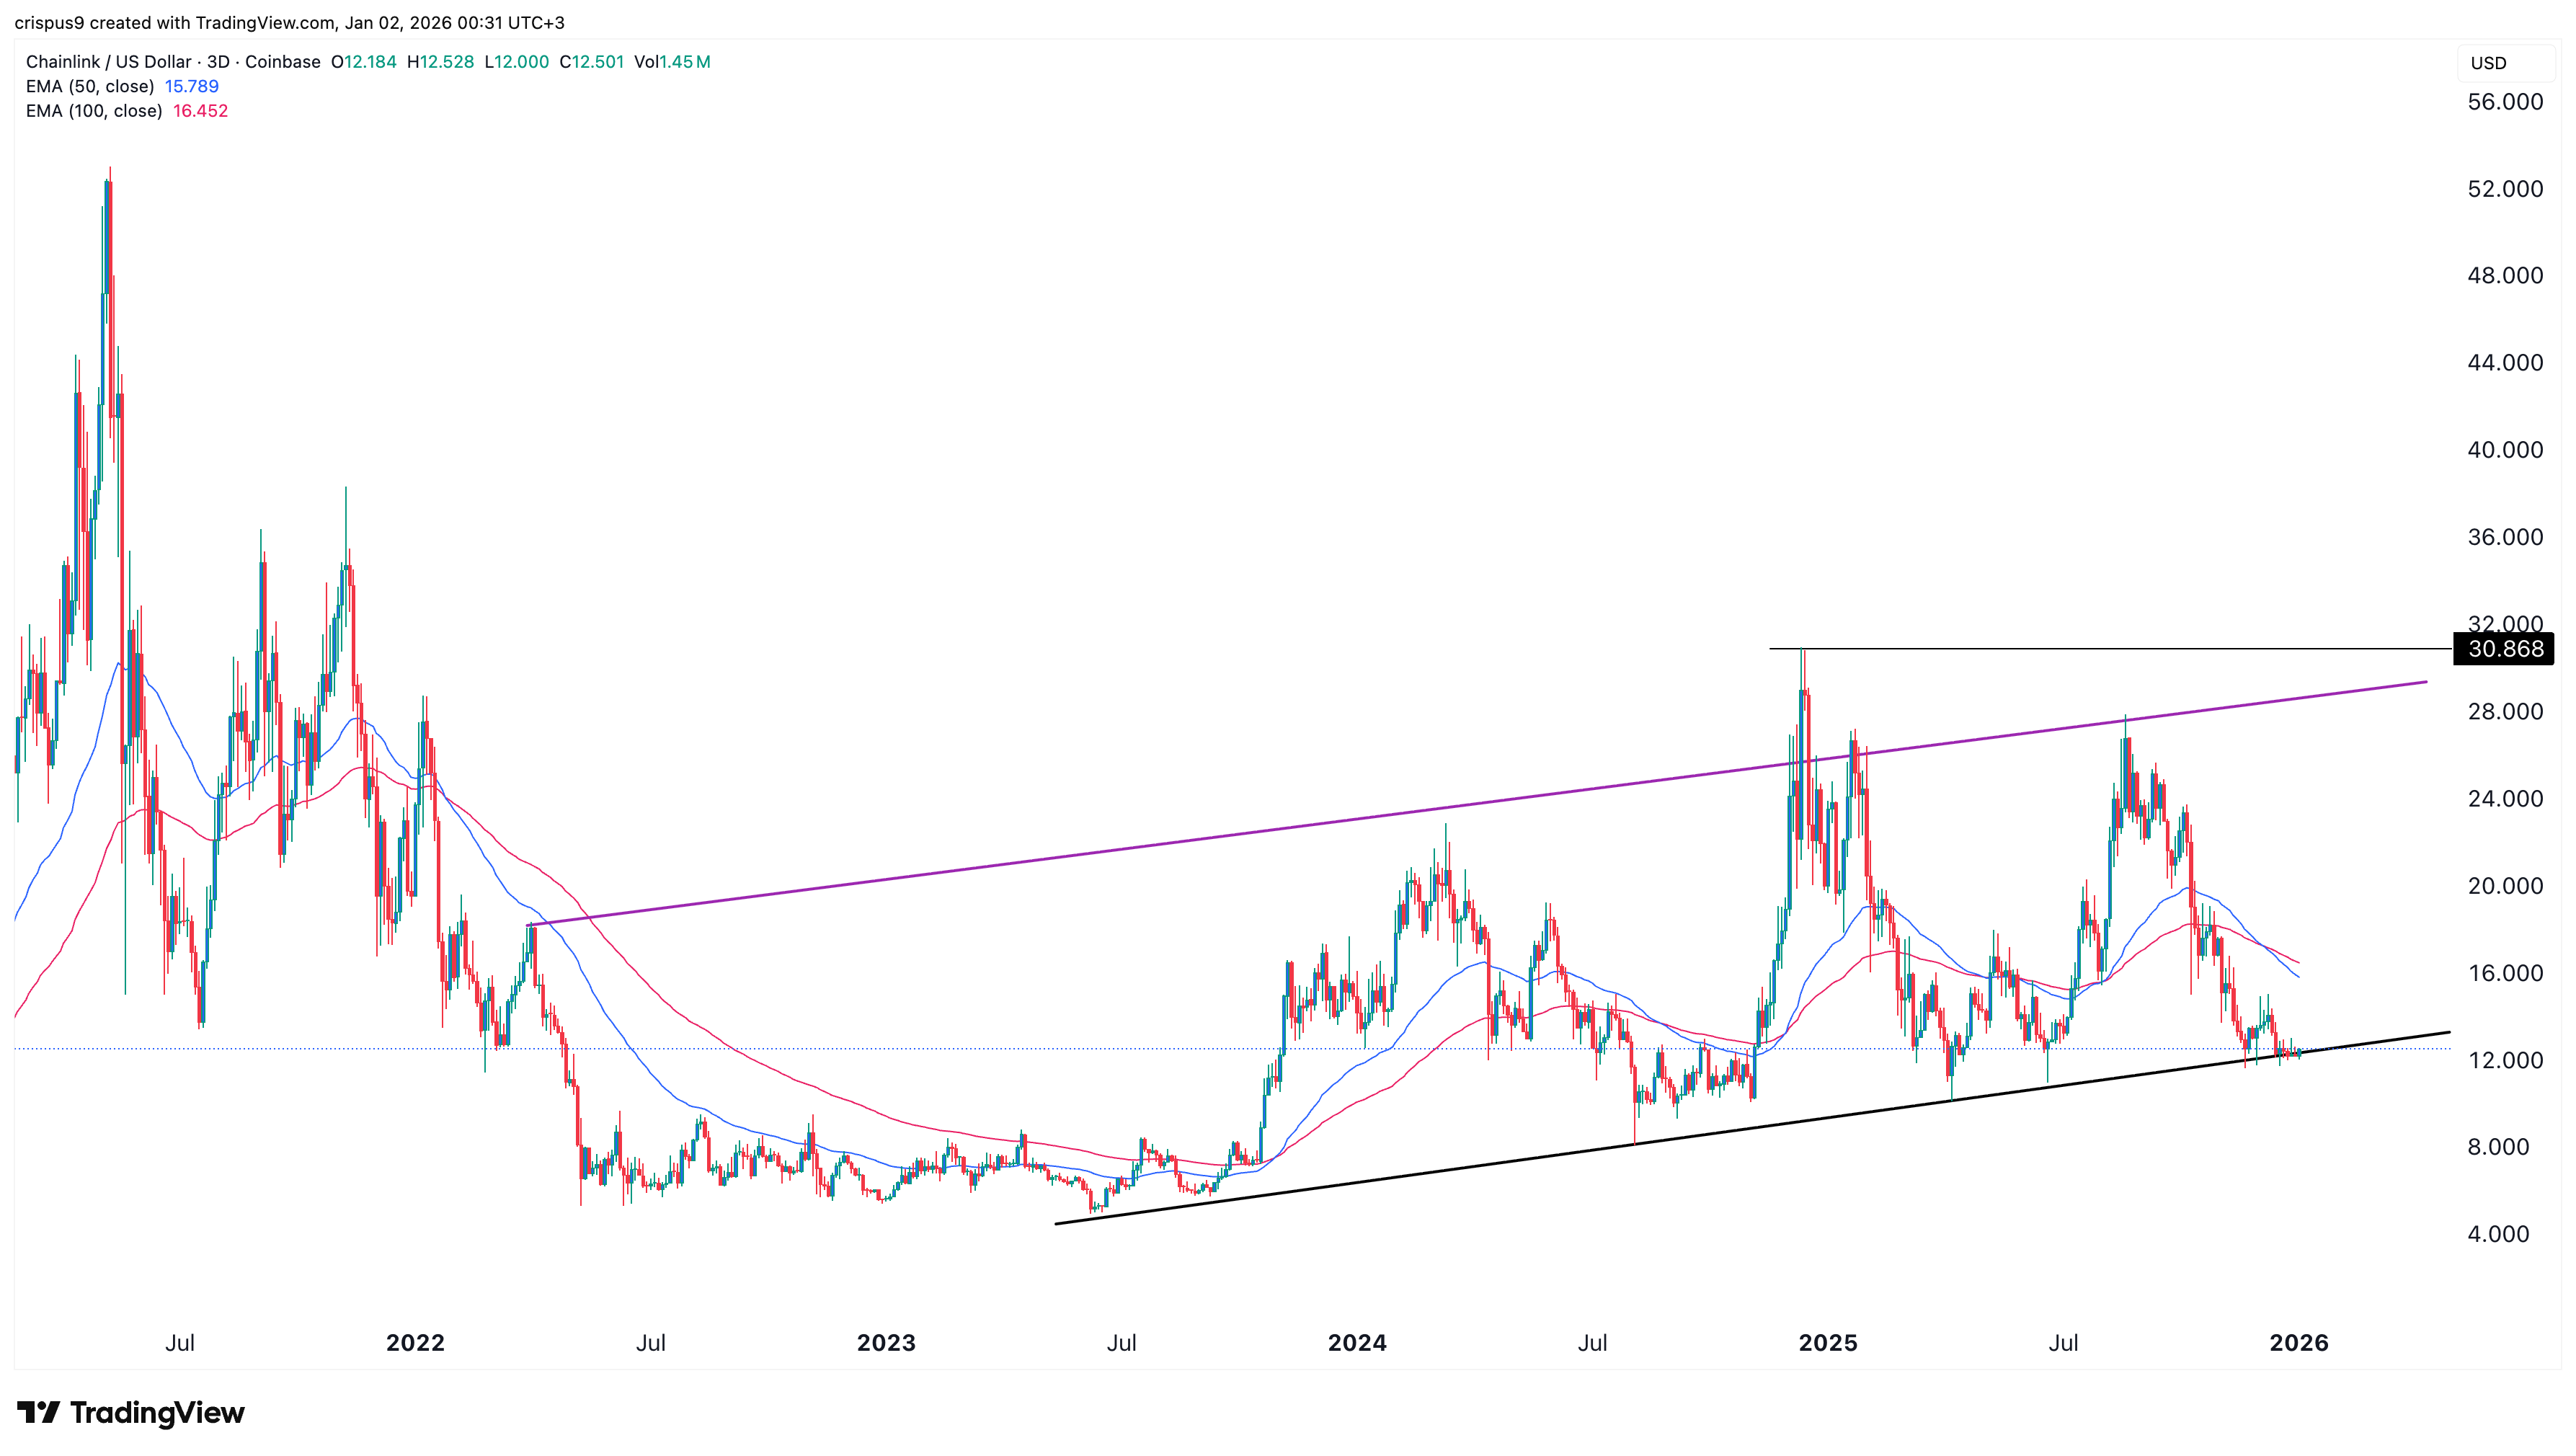
The three-day chart shows the LINK token has crashed from a high of $30.86 in December 2024 to $12.50. It has moved below the 50-day and 100-day Exponential Moving Averages (EMA).
The coin has remained slightly above the ascending trendline that connects the lowest swings since June 2023. That is a sign that bears are afraid of selling the token below that level.
The risk, however, is a sign that the coin has formed a head-and-shoulders pattern, a popular bearish sign. Therefore, a drop below that level will signal more downside, potentially to the psychological $10 level.
On the flip side, the most likely scenario is a rebound as bulls target the psychological $20 level.
READ MORE: Nvidia Stock Price Forecast 2026: Reasons it May Hit $300 Soon