


XRP price continued its freefall, plunging below the important support level at $2 and mirroring the broader crypto and stock markets. Ripple’s token dropped to $1.8930, its lowest level since January 2nd, and 21% below the year-to-date high.
Key XRP Ledger Metric Jumps 43%
The XRP price has dropped sharply due to ongoing weakness in the crypto market. This decline is mostly because of the ongoing jitters over Greenland, rising Japanese bond yields, and the stalled CLARITY Act.
On the positive side, data shows that the XRP Ledger (XRPL) is becoming a major player in the Real-World Asset (RWA) tokenization industry.
Data compiled by RWA shows that total value locked (TVL) in its ecosystem jumped by 43% over the last 30 days to over $400 million. This growth was driven by VERT Capital, Ctr Alt, and Mercado Bitcoin.
At the same time, the XRP Ledger has become a major player in the stablecoin industry, with the market capitalization of all tokens in the network rising by 11% in the last 30 days to over $387 million.
READ MORE: Polygon Price Prediction: Top Reasons POL May Rebound Soon
Most of this growth is in Ripple USD (RLUSD), the stablecoin it launched in 2024. In a statement, Monica Long, Ripple’s president, predicted that stablecoins will be the foundation for global settlement and not an alternative rail.
Brad Garlinghouse, Ripple Labs’s CEO, will share the network’s plans for tokenization in a panel discussion at the World Economic Forum in Davos later on Wednesday. Other members of the panel will be Coinbase’s Brian Armstrong and the heads of Standard Chartered, Euroclear, and France’s Central Bank.
XRP Price Technical Analysis
The daily timeframe chart shows that the XRP price has come under pressure in the past few weeks, with its attempts to recover this year facing substantial resistance at $2.3965.
The Ripple price has moved below the 50-day Exponential Moving Average (EMA) and the Supertrend indicator. It also dropped below the Ultimate Support level of the Murrey Math Lines tool at $1.9530.
The two lines of the Percentage Price Oscillator have made a bearish crossover, while the histogram has moved below the zero line.
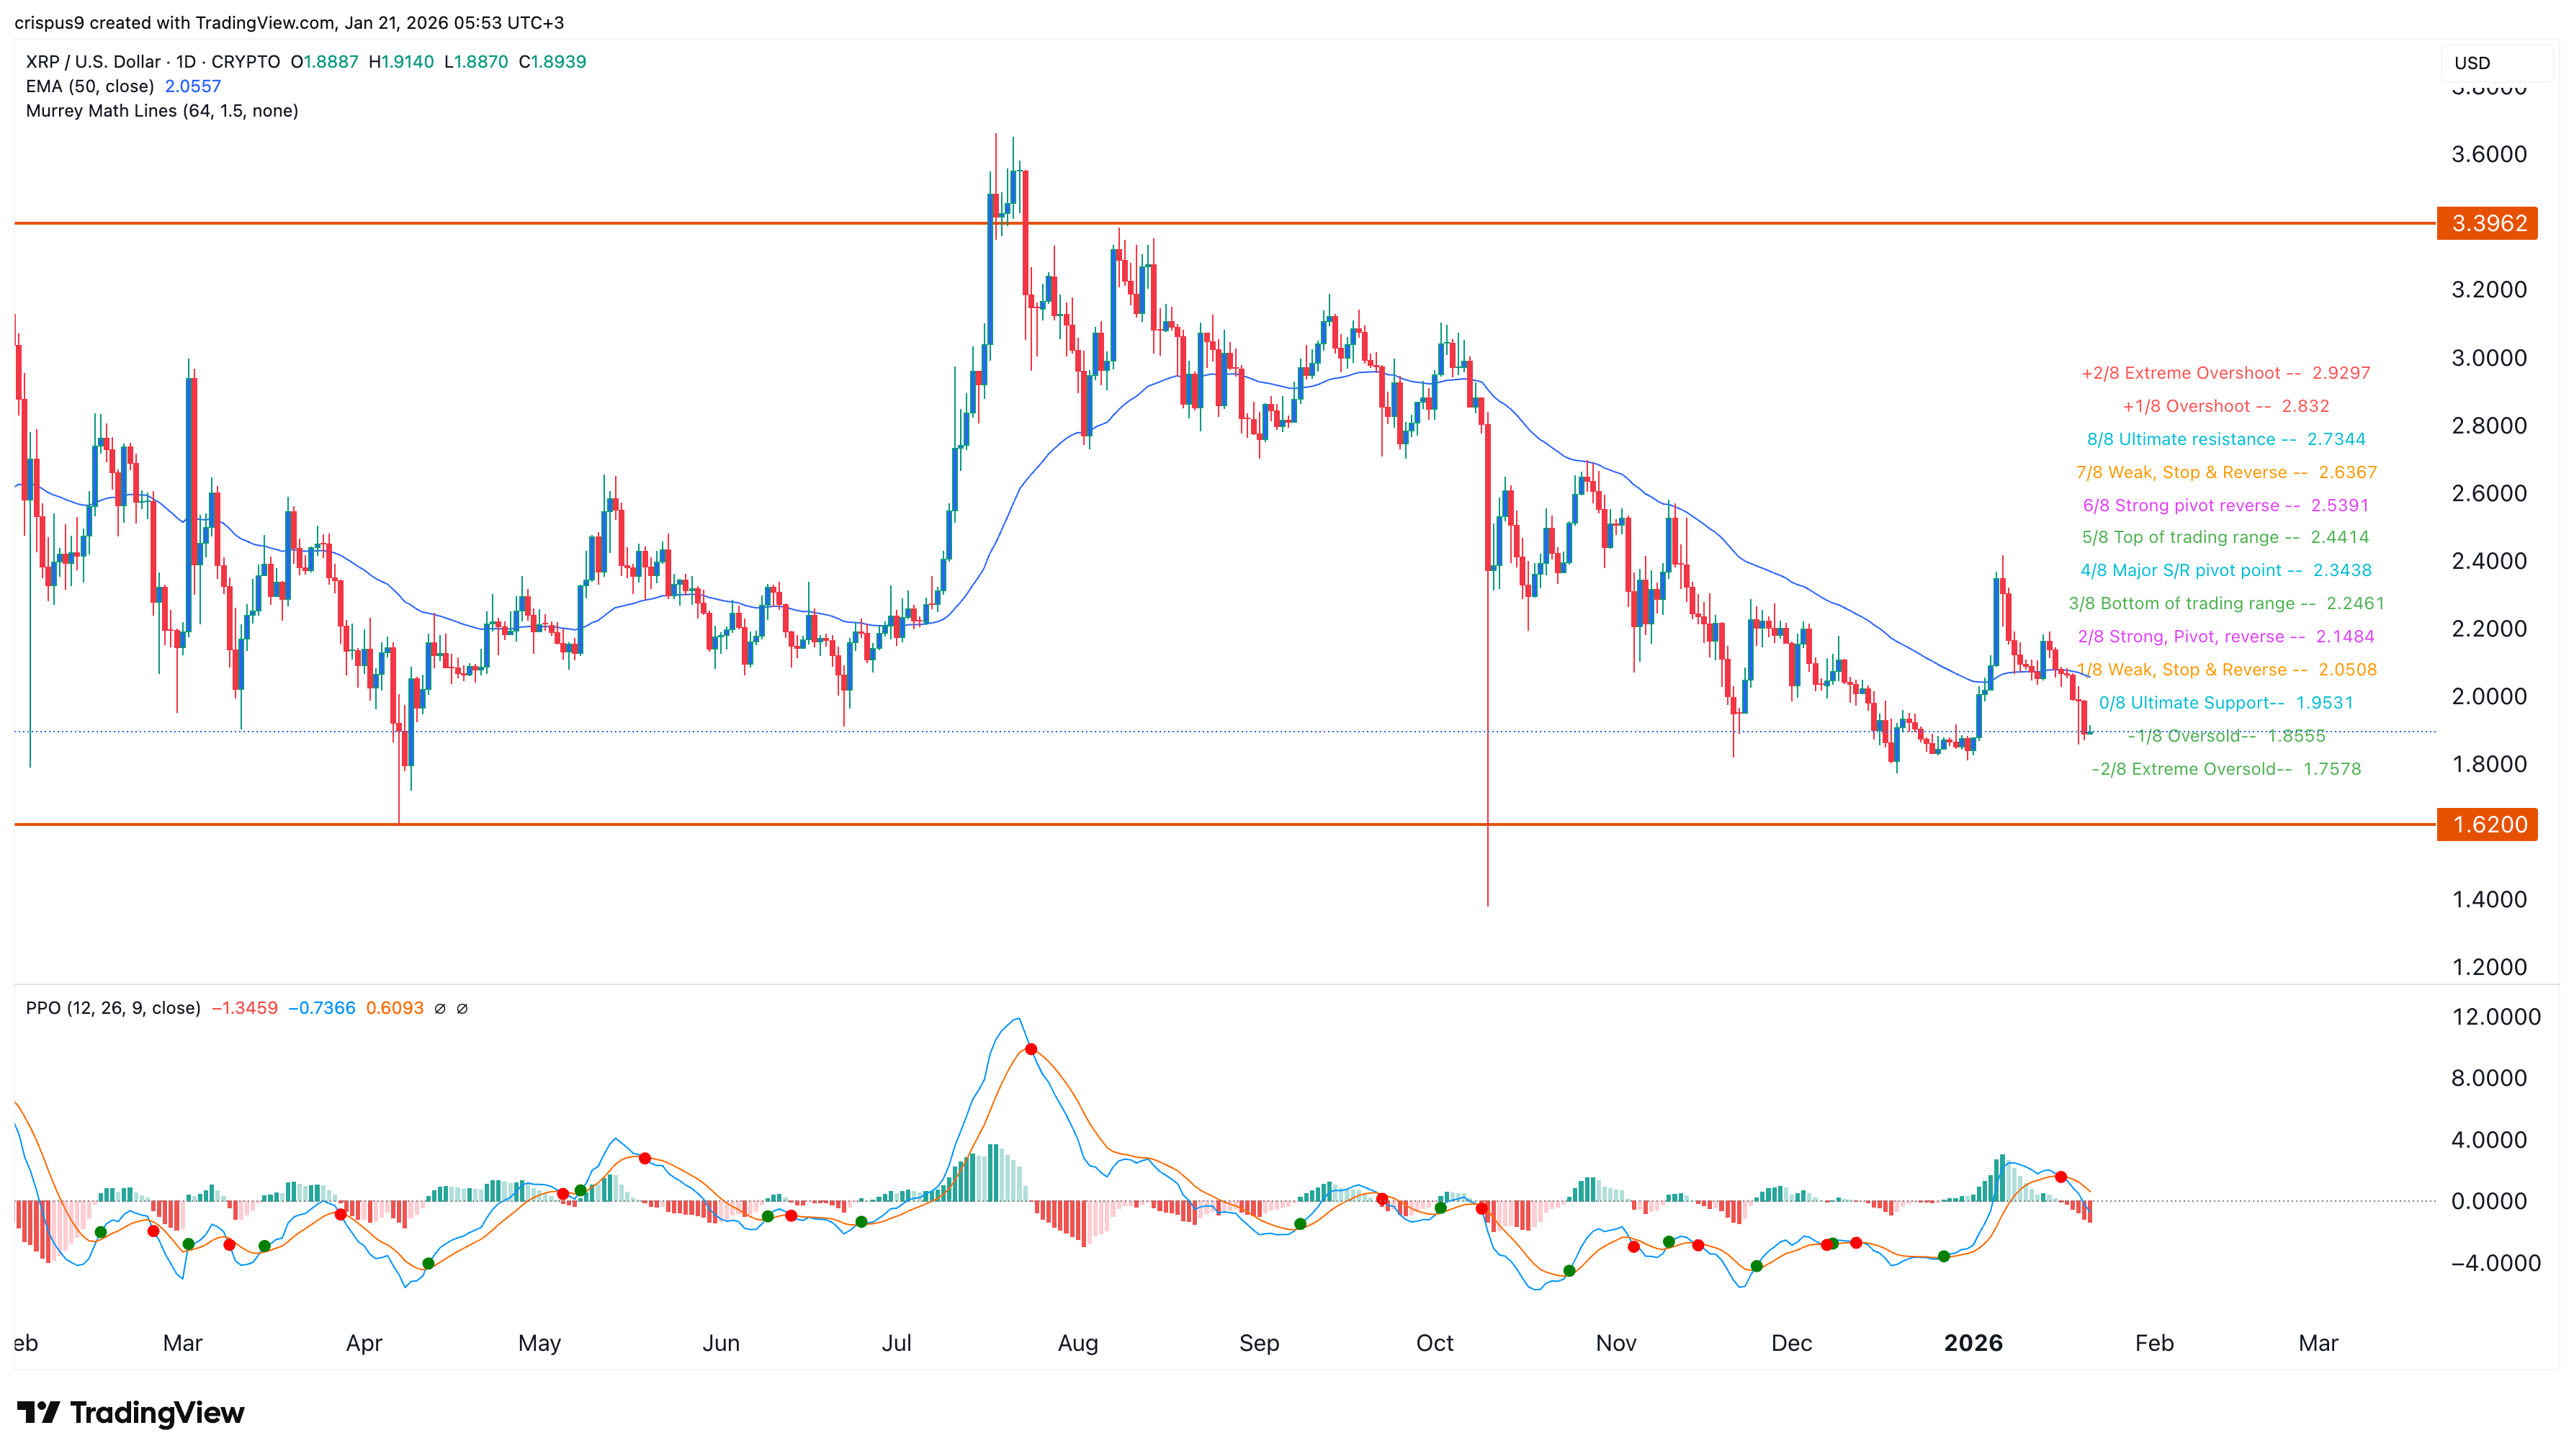
Therefore, the most likely scenario is where the tokens continue falling as sellers target the key support level at $1.7715, its lowest level in December, and the Extreme Oversold level of the Murrey Math Lines tool.
READ MORE: Ethereum Price Prediction as Staking Ratio Surges and ETH Supply Dips