


Ethereum price could be on the verge of a strong bearish breakout despite the ongoing ecosystem growth. ETH token was trading at $2,957, down by 12% from its highest level this year.
JPMorgan My OnChain Net Yield Growth Continues
ETH price retreated even as the newly launched My OnChain Net Yield Fund (MONY) gained $100 million in assets on the first day. This is a major development that shows strong demand for the product, as its annual management fee is 0.16% and the minimum investment is $1 million.
The inflows brought the total amount of money in Ethereum’s tokenized assets to over $13 billion, up by 7% in the last 30 days. The other notable funds in the network are from companies such as BlackRock, Franklin Templeton, WisdomTree, and Ondo.
Analysts believe that Real-World Asset (RWA) tokenization is still in its infancy and that assets worth trillions of dollars will eventually be tokenized.
READ MORE: NVIDIA Stock Price Flashes Rare Pattern Pointing to a 30% Crash
Most of this tokenization will be on key industries like equities and credit. For example, companies like Ondo and Robinhood have already started offering hundreds of tokenized stocks and ETFs.
Meanwhile, more data shows that Ethereum’s network has continued to grow since developers launched the Fusaka upgrade. Data compiled by Nansen shows that the network’s transaction volume jumped by 36% over the last 30 days to over 62.2 million. Similarly, the number of active addresses rose by 55% to 13.8 million.
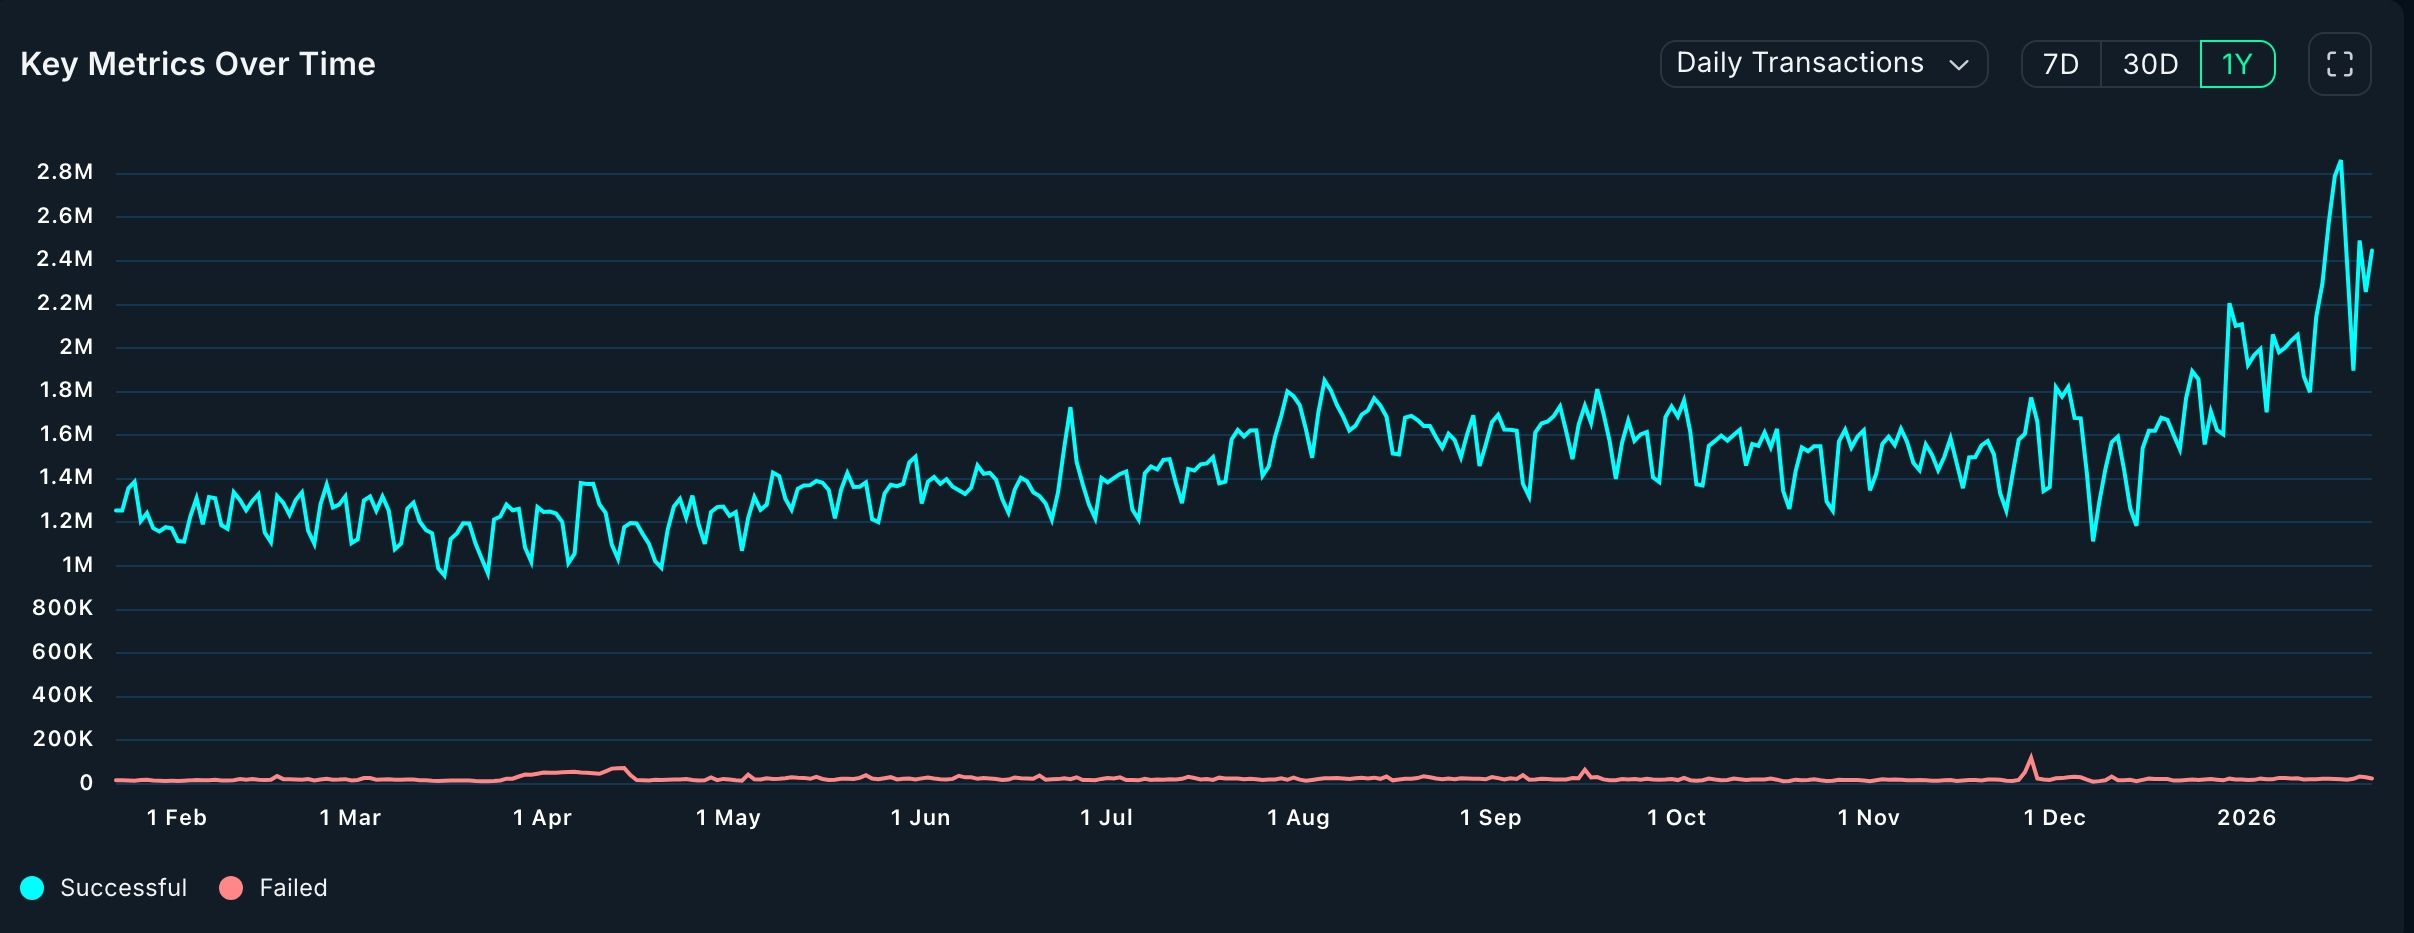
More Ethereum metrics have continued to rise. For example, the stablecoin supply in the network has continued to rise and currently stands at over $161 billion, giving it a substantial market share in an industry with over $310 billion in assets. Its staking ratio has soared, while Ethereum’s supply in exchanges has tumbled.
Ethereum Price Technical Analysis
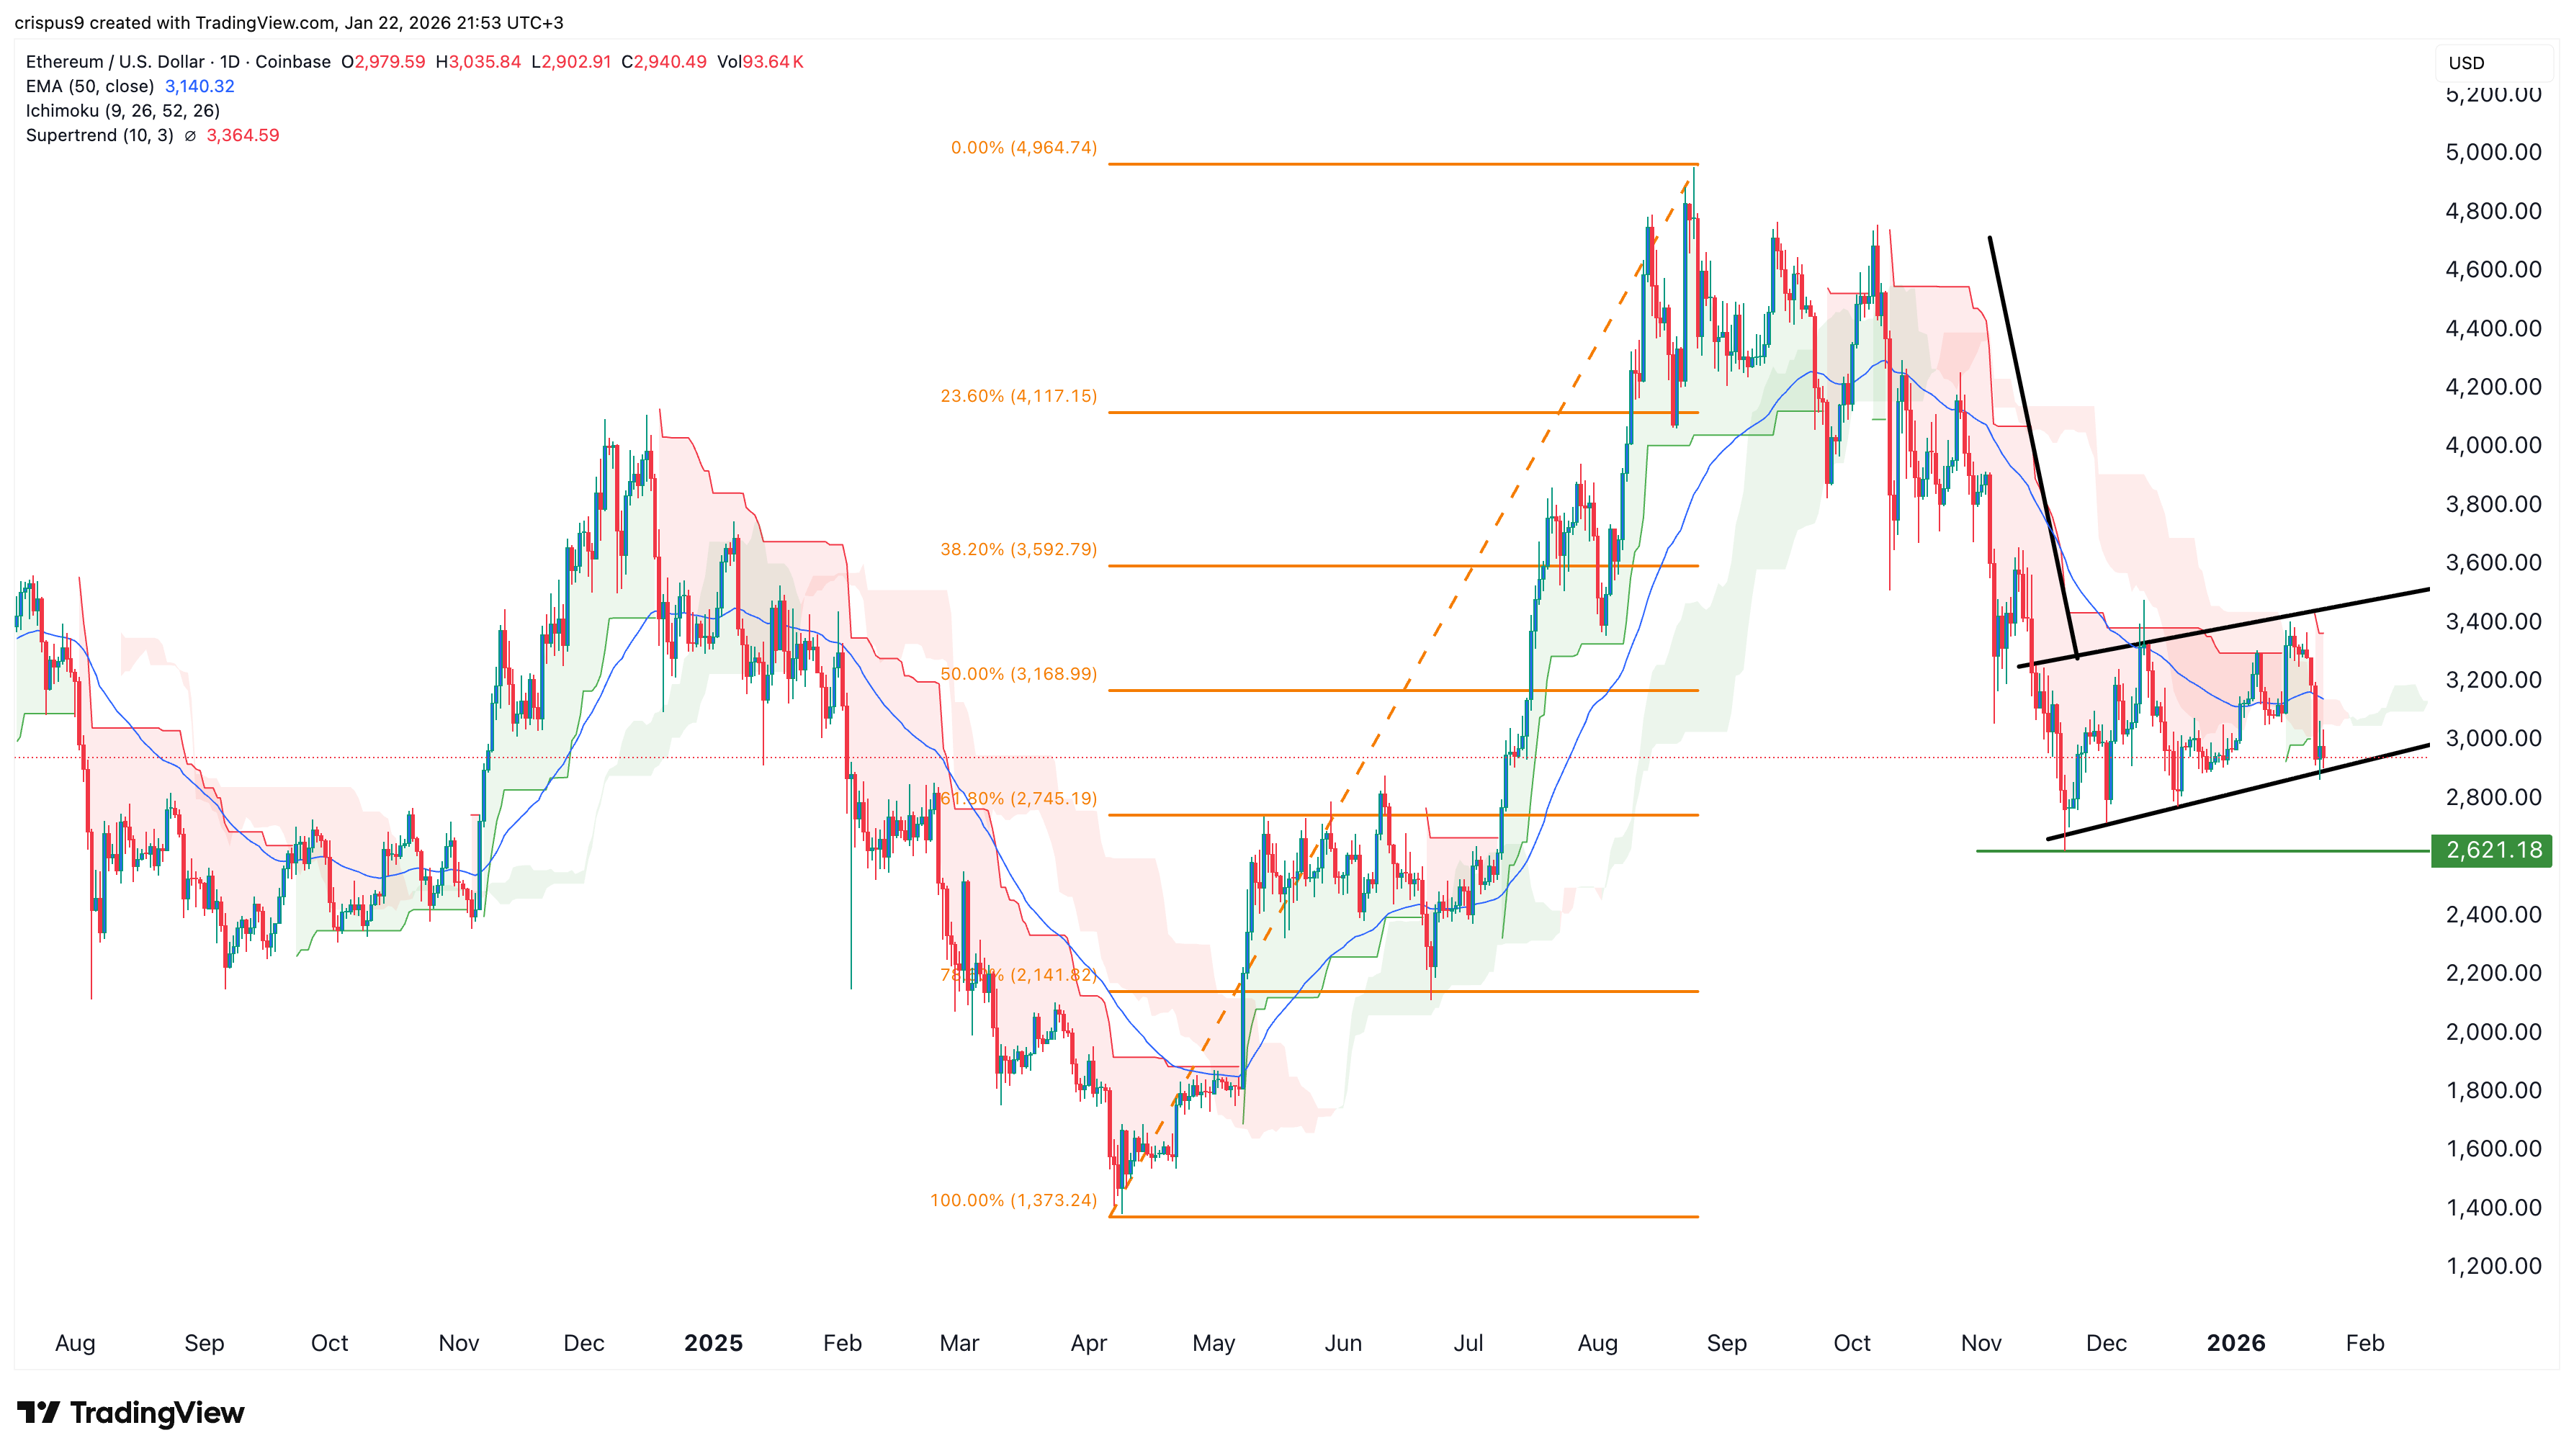
The daily timeframe chart shows that the Ethereum price could be at risk of a deep dive in the coming days. It has formed a risky bearish flag pattern, consisting of a vertical line and an ascending channel.
The coin has moved below the 50-day Exponential Moving Average (EMA) and the 50% Fibonacci Retracement level at $3,168.
It also remains below the Supertrend and the Ichimoku cloud indicators, a sign that bears are in control for now.
Therefore, the most likely scenario is a bearish breakdown in the coming days. Such a move may see it drop to the key support level at $2,620, its lowest level in November, which aligns with the 61.8% Fibonacci Retracement level. A drop below that level will point to more downside, potentially to $2,500.
READ MORE: Billionaire Novogratz Delivers His Bitcoin Price Prediction and a Major Warning