


Solana price has entered a technical bear market this year, falling from a record high of $300 in 2025 to $110 today. Its crash has erased billions of dollars in value and mirrored that of other major cryptocurrencies such as Ethereum and Bitcoin.
Solana Chain Fees are Soaring as Transactions Soar
Despite the SOL price crash, there are signs that Solana’s network is firing on all cylinders. For example, Solana’s chain fees have increased by 90% over the past 30 days to over $26.4 million. This growth means that it is now closing the gap with Justin Sun’s Tron, which made over $28 million in the same period.
Solana has also achieved other major milestones this year, a trend that may continue when the team launches the closely watched Alpenglow upgrade. Alpenglow will introduce additional features to the network, including faster seeds and a complete architectural overhaul.
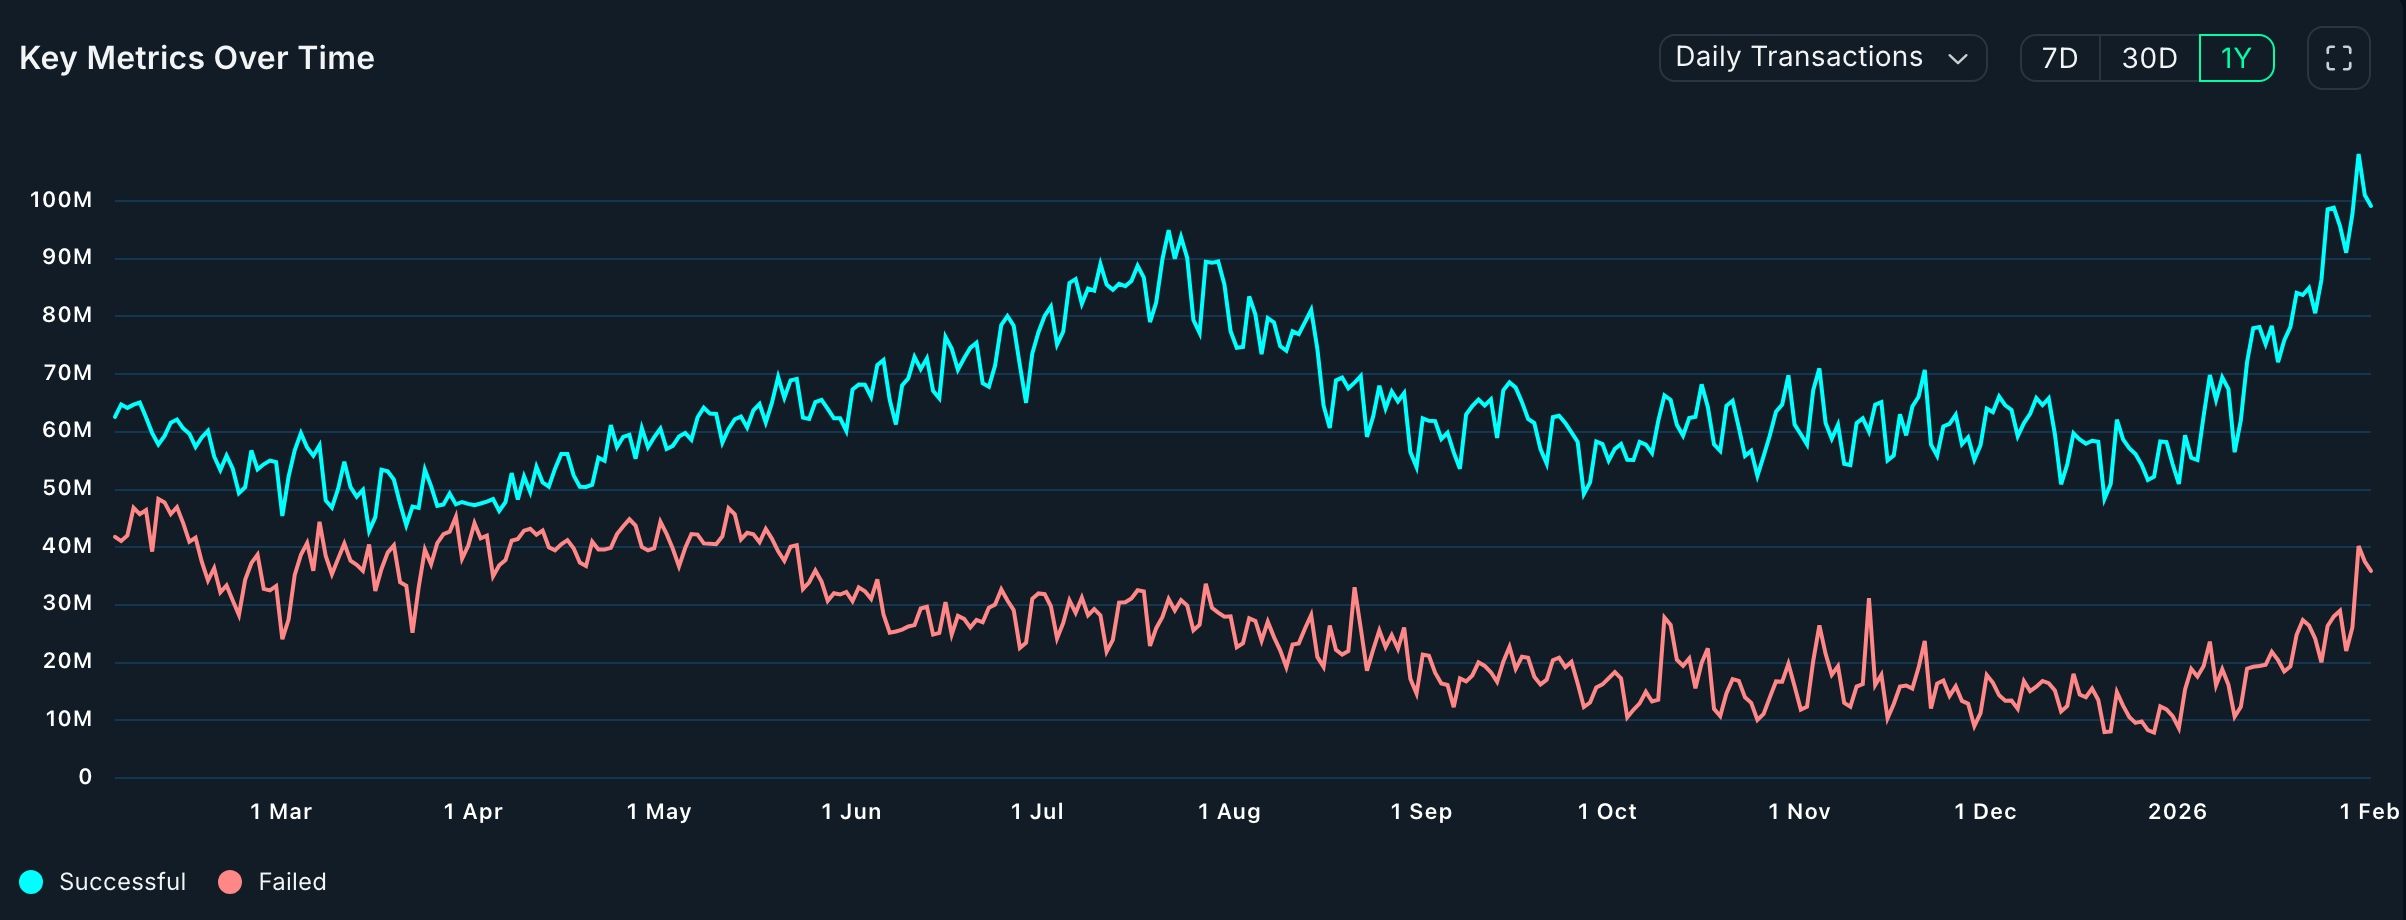
Solana’s network had over 100 million active addresses in the last 30 days, while its transaction count jumped to over 2.3 billion. Its active addresses and transactions are much more than those of other chains, including popular names like Ethereum and BNB Chain.
The ongoing growth of Solana is occurring despite the fact that meme coins in the ecosystem have declined in the past few months. Data shows that the market capitalization of all these meme coins dropped to $4.8 billion from the all-time high of over $25 billion.
READ MORE: PayPal Stock Price is in a Freefall: Will it Have a Relief Rally After Earnings?
Data shows that Solana’s network has continued to outperform other chains. For example, the total volume on its decentralized exchange (DEX) increased to over $116 billion in the last 30 days, substantially higher than on other chains such as Ethereum and BNB Chain.
Solana Price Technical Analysis
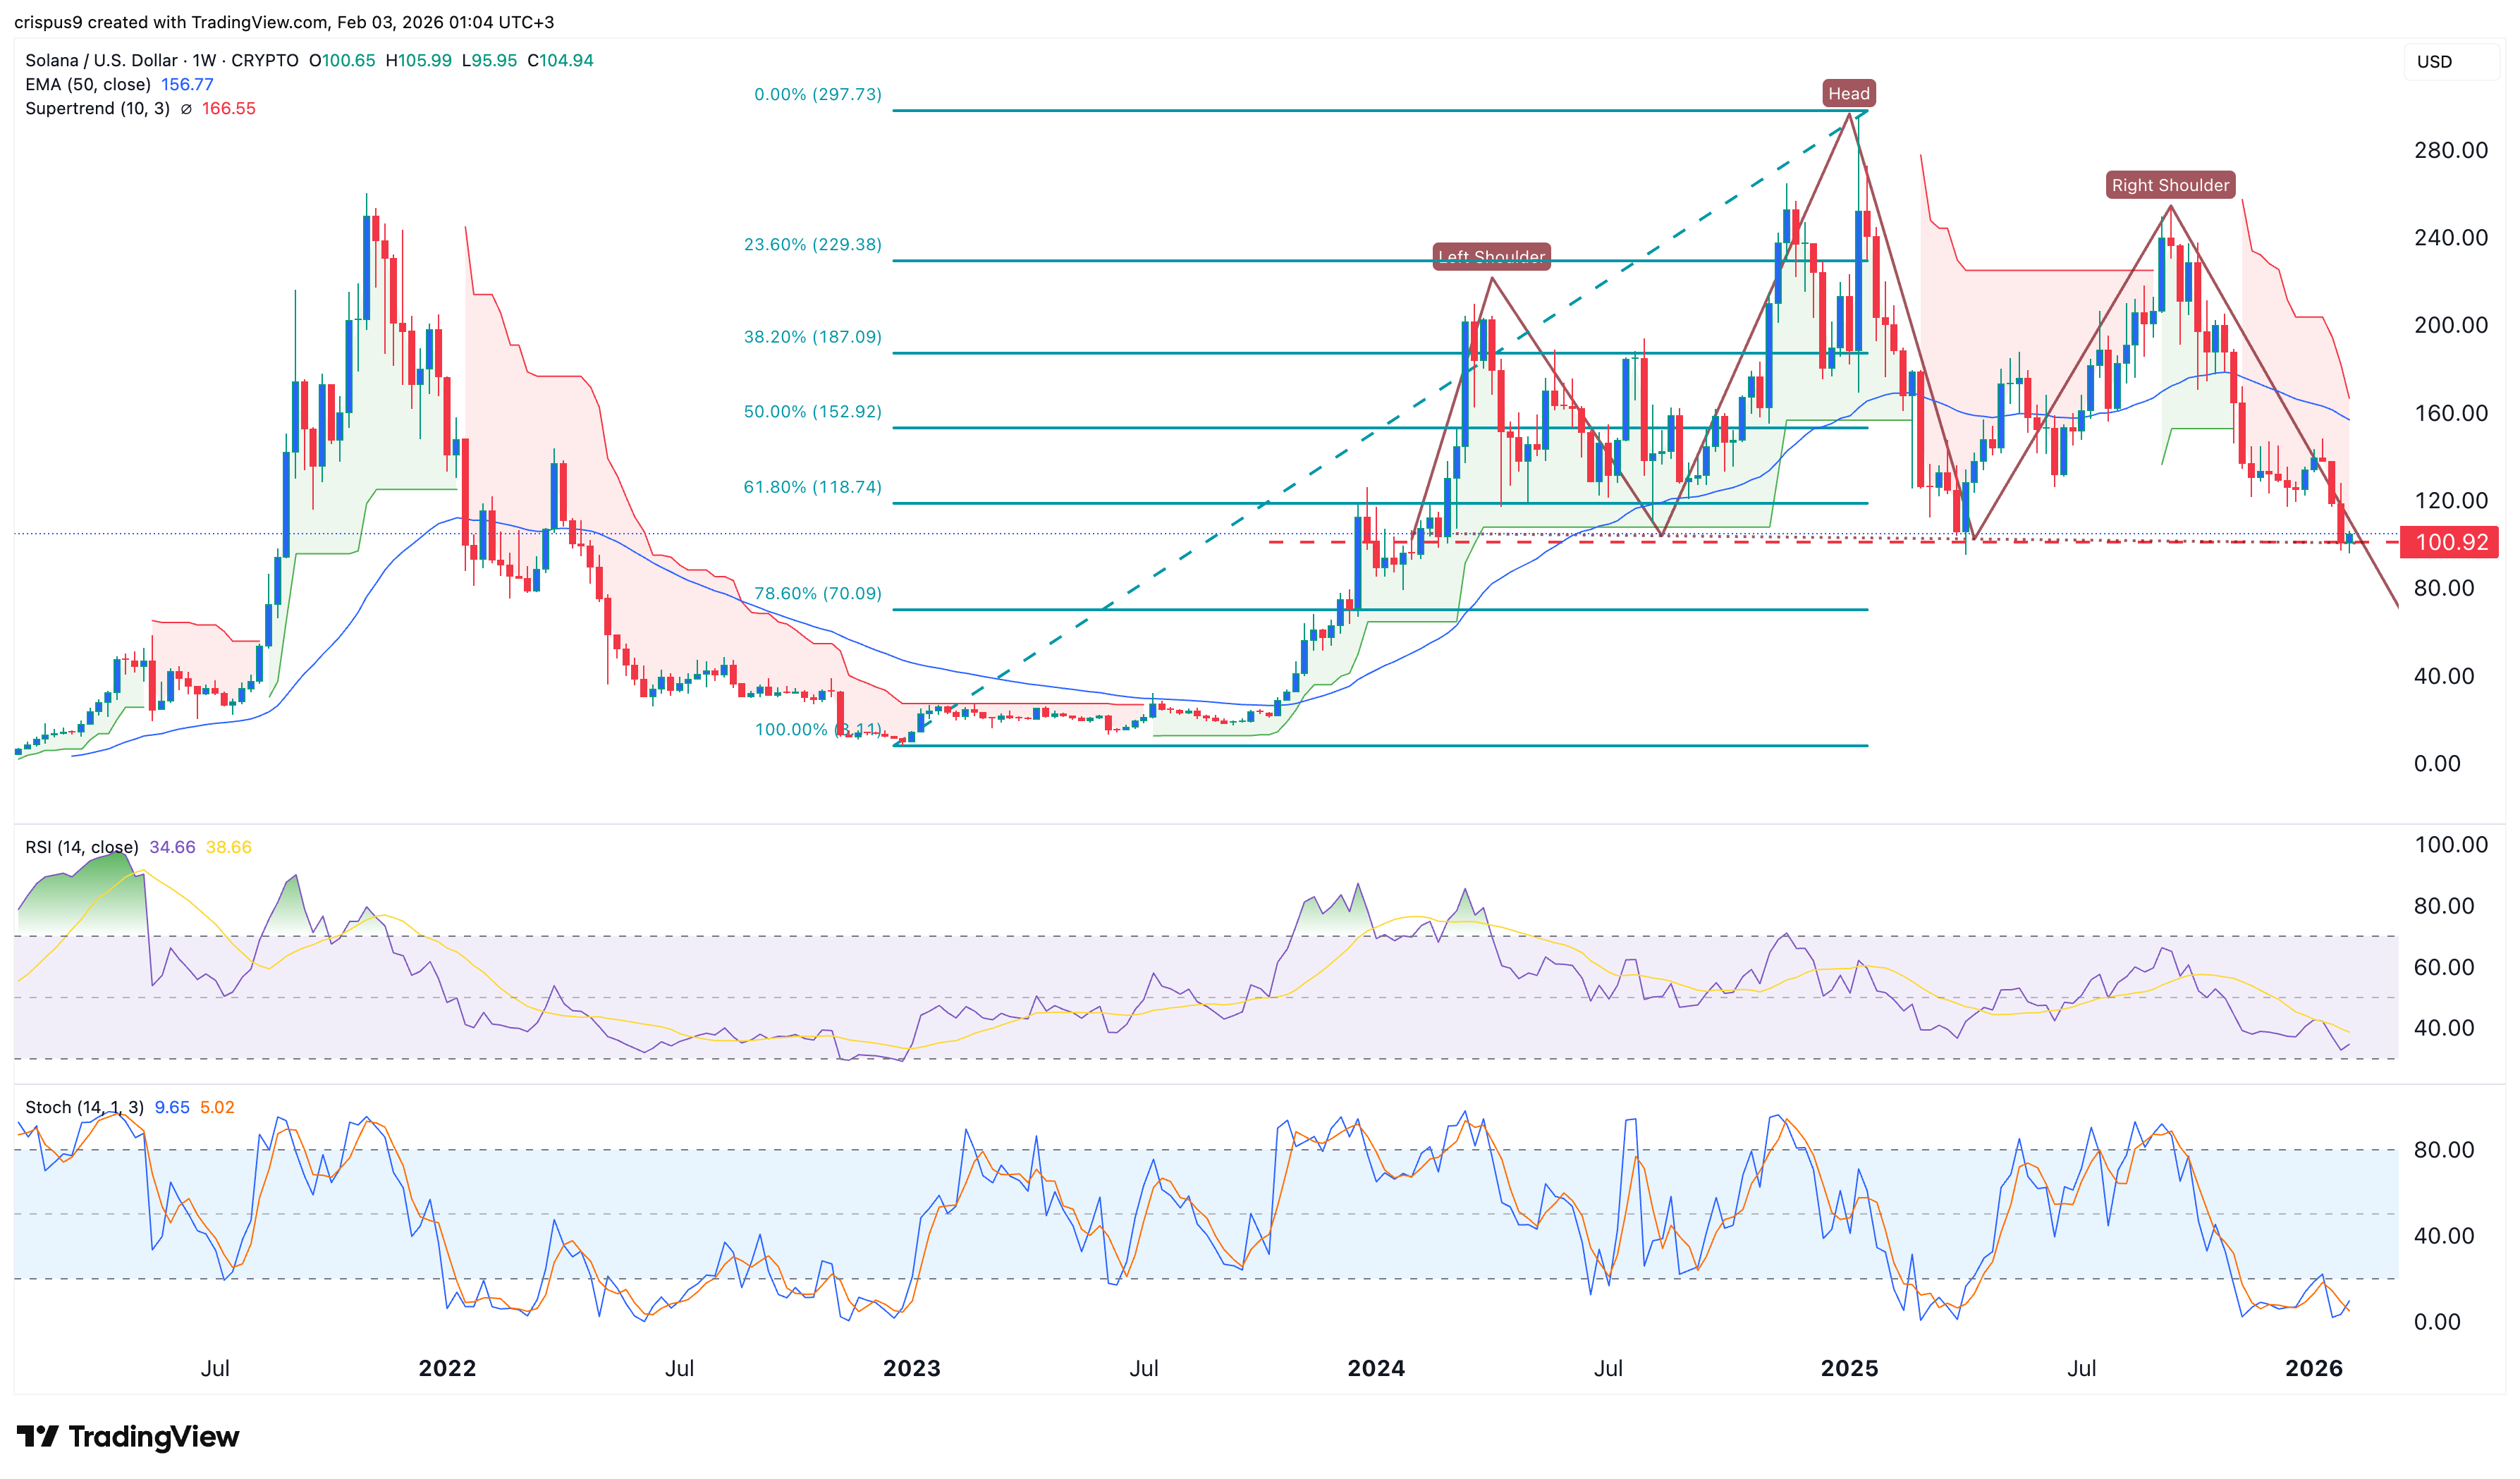
While the Solana price has solid fundamentals, technicals paint a different picture. The coin has formed a giant head-and-shoulders pattern and is now sitting at its neckline. It has moved below the 61.8% Fibonacci Retracement level, confirming a bearish breakout.
SOL price has moved below the 50-week Exponential Moving Average and the Supertrend indicator. Additionally, the Relative Strength Index (RSI) and the Stochastic Oscillator have continued to fall.
Therefore, the most likely SOL price forecast is bearish, with the next key level to watch being at $70, the 78.6% Fibonacci Retracement level. It will then bounce back later this year, now that spot SOL ETF inflows and staking inflows have continued rising.
READ MORE: NVIDIA Stock Price Catalysts This Week: Crash or Rally Ahead