


Dogecoin price continued its rebound, reaching its highest level since January 31st as the crypto market rally accelerated. The DOGE token rose to $0.1195, well above the year-to-date low of $0.0796. It remains 63% from its highest level in September last year.
Dogecoin Price Rises as Crypto Market Rally Continues
DOGE price has staged a strong comeback in the past few weeks, mirroring the performance of Bitcoin and other altcoins. Bitcoin has moved above the key resistance level at $70,000, while the crypto market cap jumped to $2.42 trillion. Other notable gainers in the cryptocurrency market were Pepe Coin and Pi Network.
The ongoing Dogecoin recovery accelerated after the U.S. released the latest consumer inflation report, which showed that the headline Consumer Price Index (CPI) fell from 2.6% in December to 2.4% in January this year. Cryptocurrencies and other risky assets tend to perform well when inflation is falling, as this typically leads to more rate cuts.
READ MORE: BitMine Stock Forms Bullish Pattern as Tom Lee Insists This is No Crypto Winter
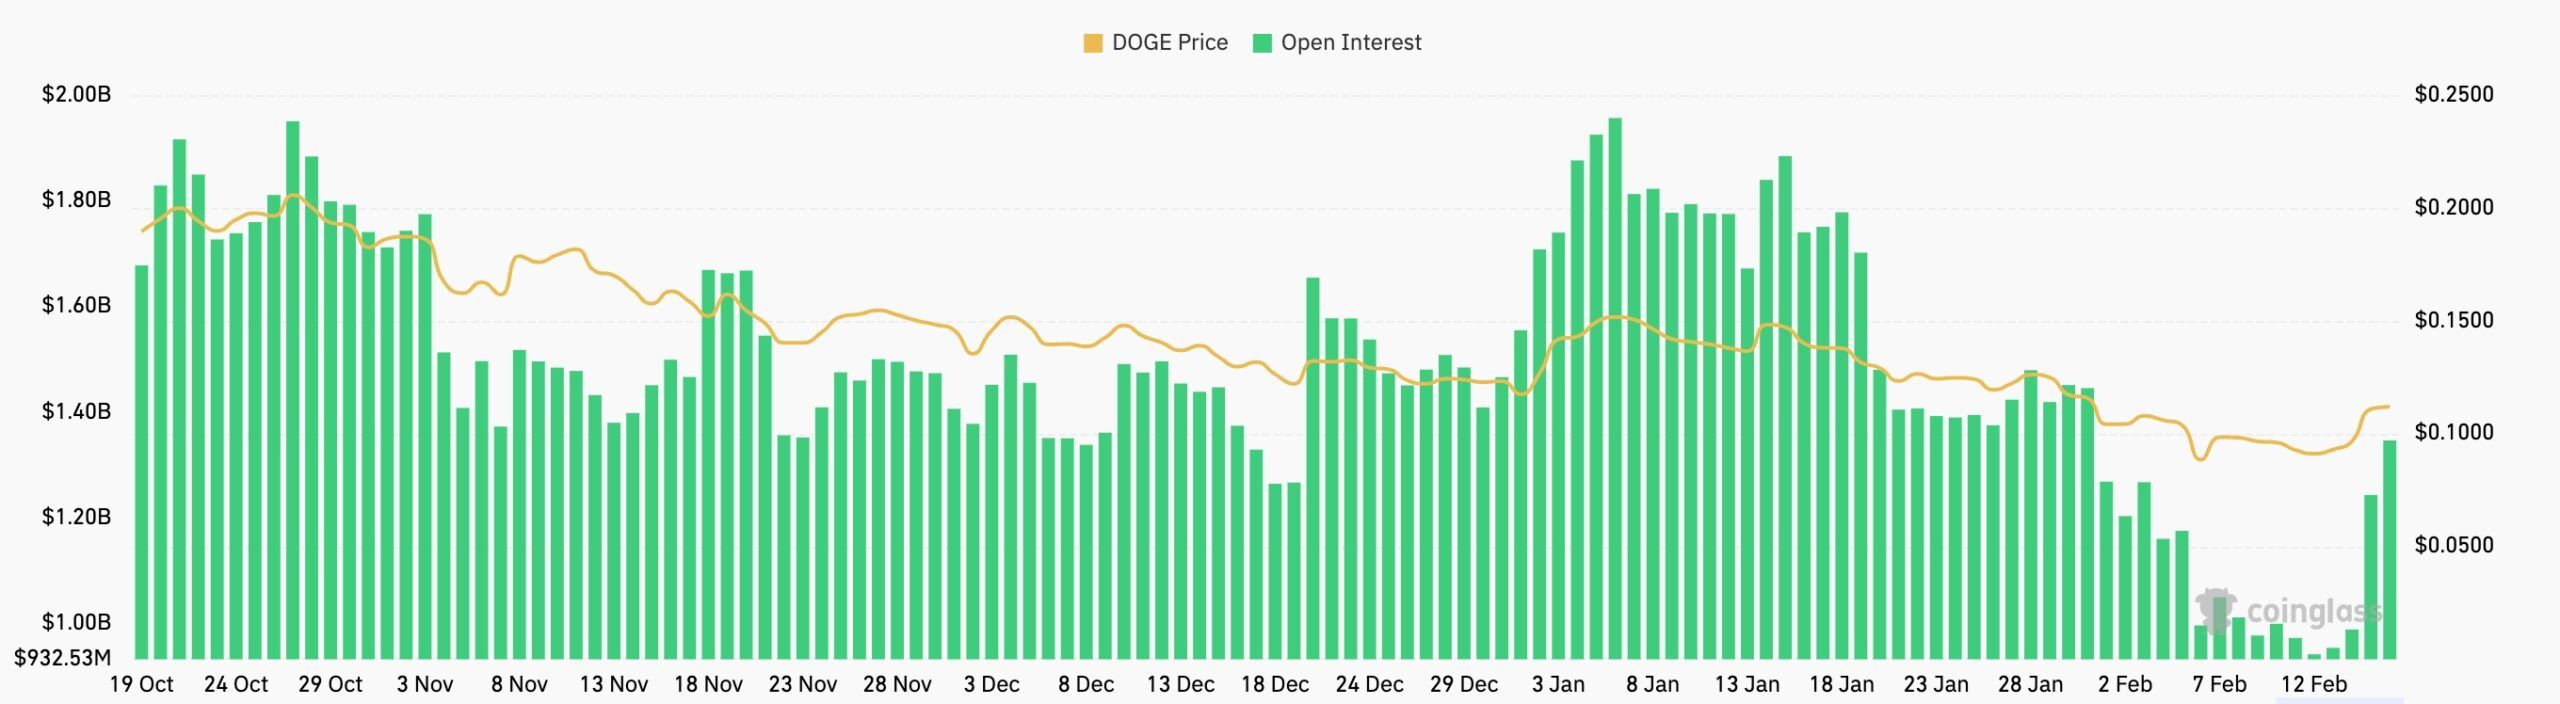
DOGE also jumped as investor demand increased, with 24-hour volume soaring to over $2.7 billion. It was the third most-traded token after XRP and Solana, which had $5.07 billion and $3.7 billion in trading volume, respectively.
The same is happening in the futures market, where the 24-hour open interest jumped to over $1.35 billion, its highest level since January 31st. It has risen sharply from last week’s low of $941 million.
Still, it is unclear whether this rebound will hold, as it could be a dead-cat bounce or a bull trap. A dead-cat bounce happens when an asset in a free fall bounces back briefly and then resumes the uptrend.
DOGE Price Prediction: Technical Analysis
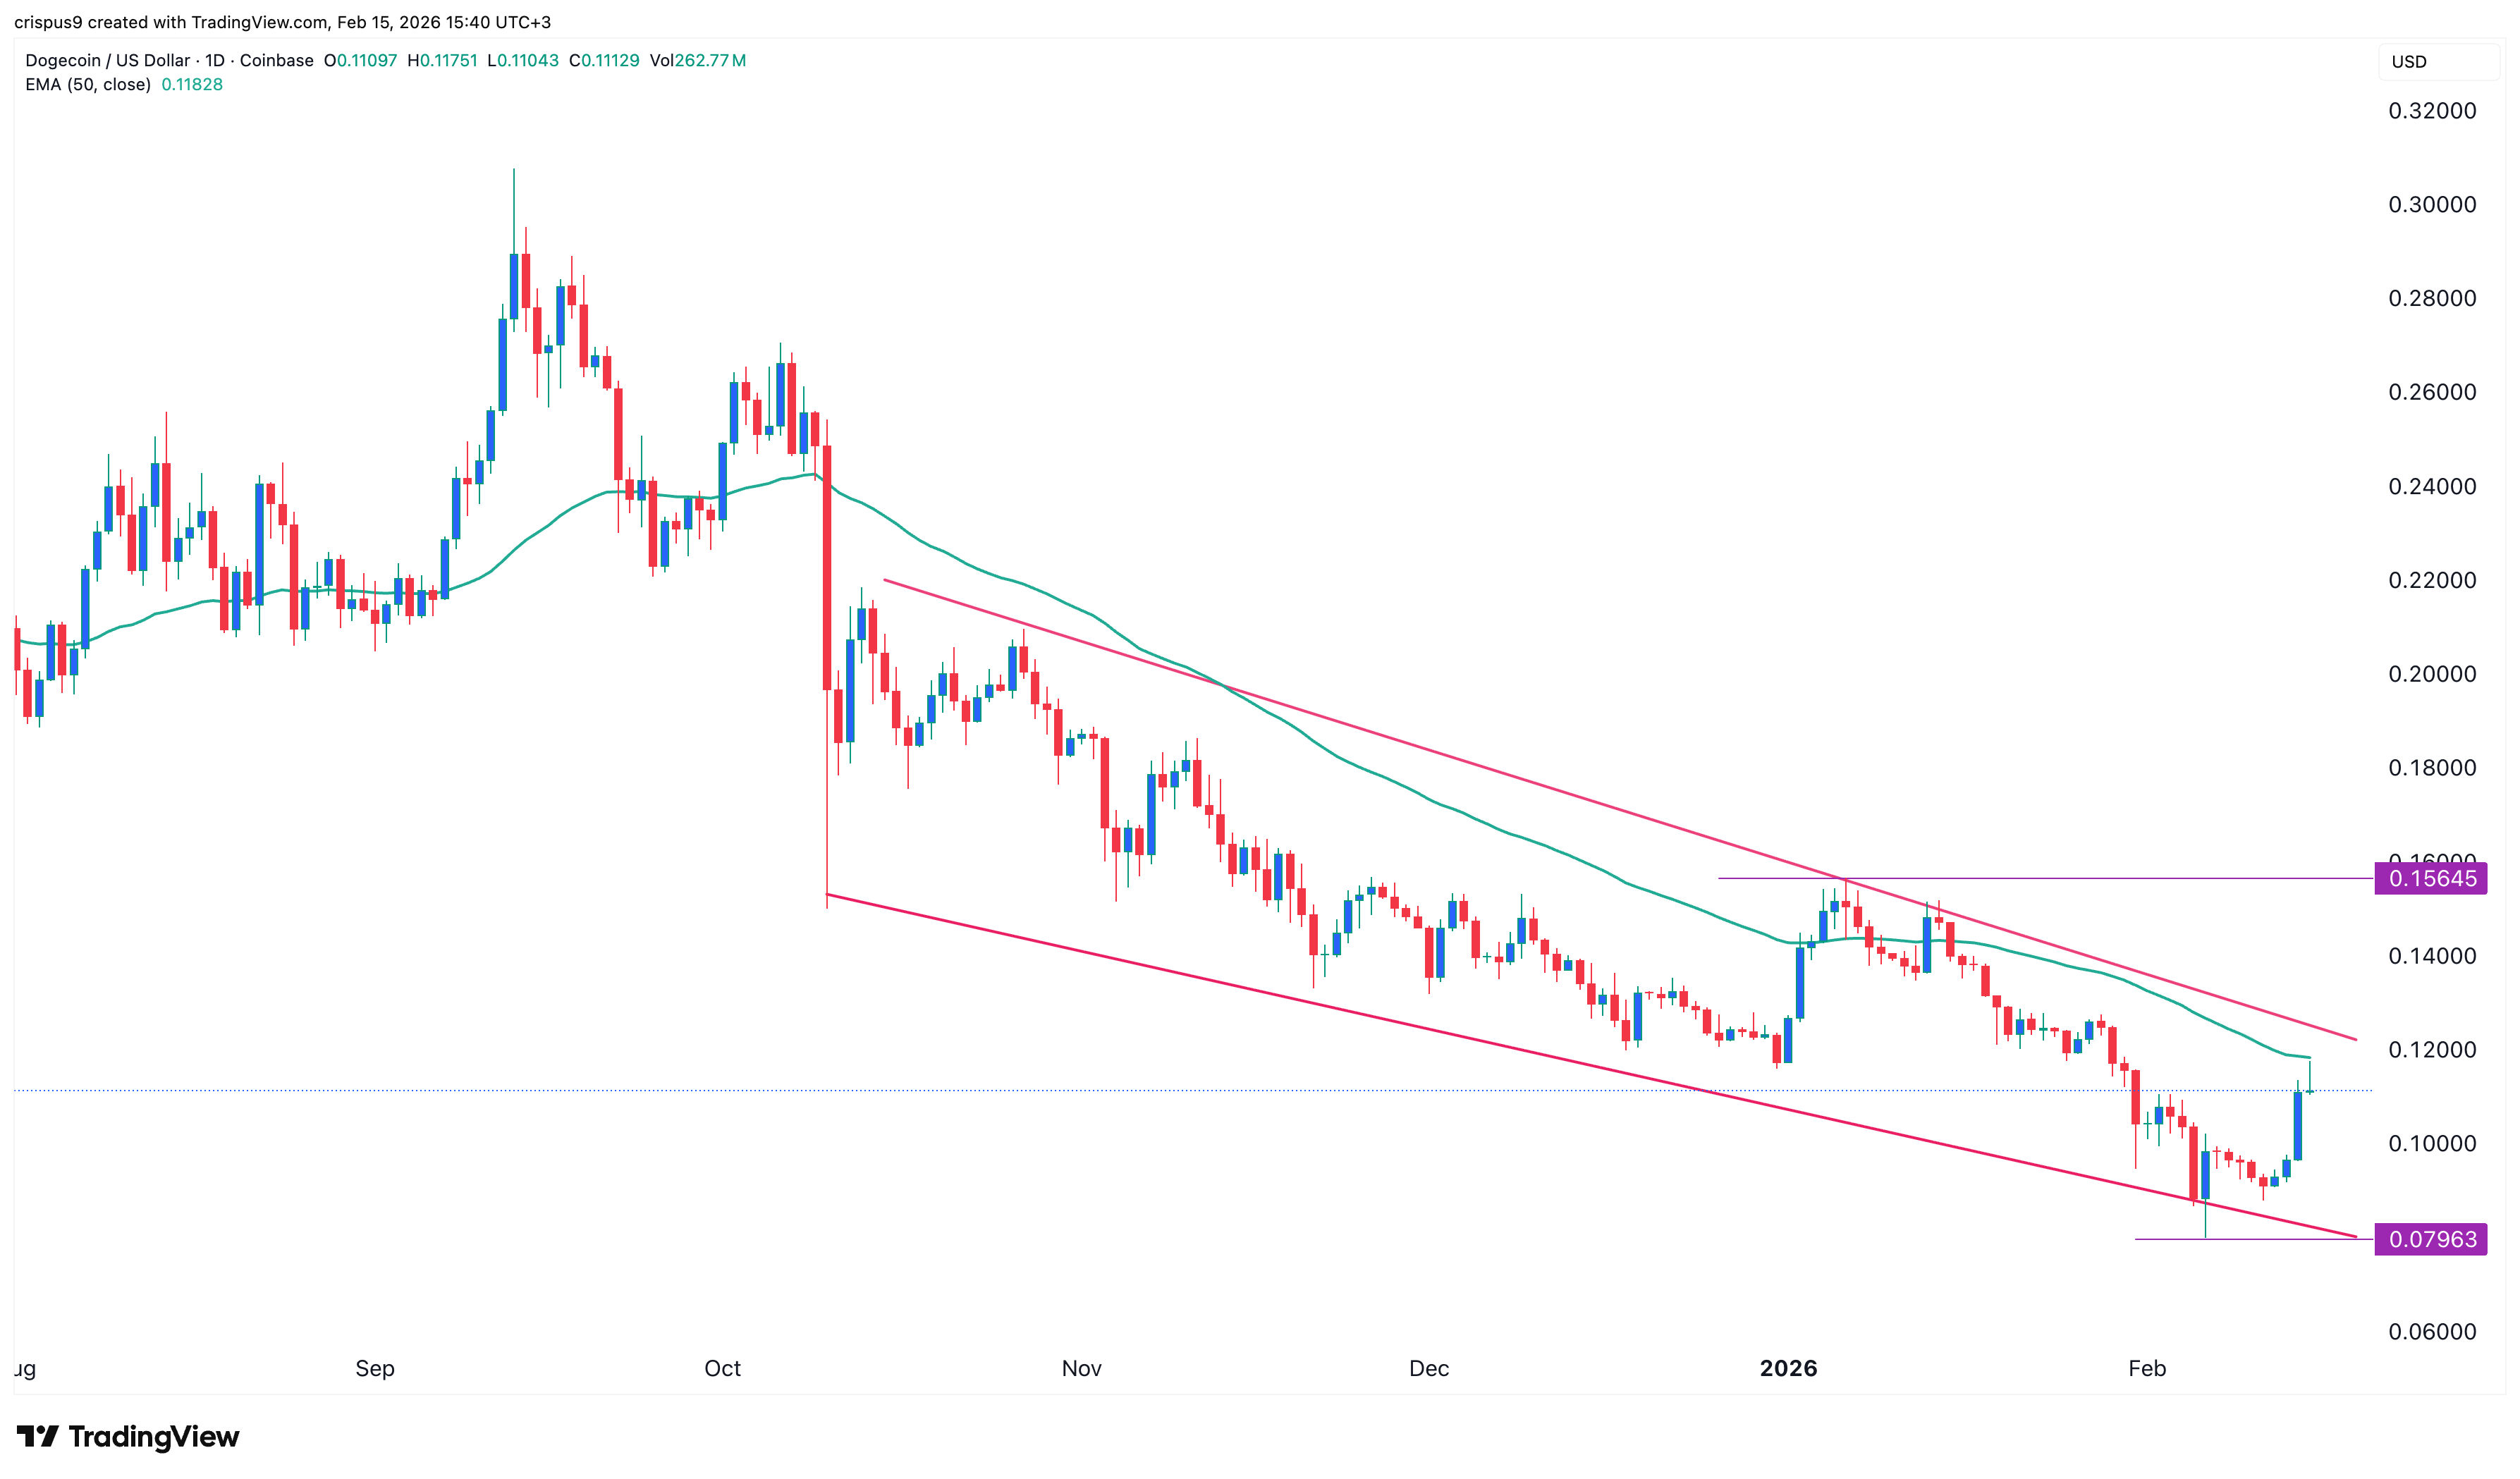
The daily timeframe chart reveals that the DOGE price has been in a pronounced downward trend over the past few months. It dropped from a high of $0.3068 in September last year to a low of $0.079 this month. It has formed a descending channel and is now slightly below its upper side.
The coin has found resistance at the 50-day Exponential Moving Average (EMA). Historically, this moving average has been a major resistance level that it has failed to breach.
There are also signs that it is forming an evening star candlestick pattern, which is a common bearish reversal sign in technical analysis.
Therefore, the most likely scenario is where it pares back some of these gains and retreats in the coming days. If this happens, it may drop and retest the key support level at $0.10.
However, a complete bullish breakout will be confirmed if it moves above the upper side of the descending channel. A move above the channel will point to more gains, potentially to the key resistance point at $0.1565, its highest level in January this year.
READ MORE: Morpho Price Goes Parabolic After Anchorage and Apollo Global Deal