


- Coinbase stock price has formed a bearish flag pattern on the three-day chart.
- This pattern points to a strong bearish breakdown in the coming weeks.
- The company has now launched a stock trading feature on its platform.
Coinbase stock price remains under pressure this year as the crypto market crash gained steam this week. COIN was trading at $162 on Tuesday, down sharply from the all-time high of $445. It has formed a bearish flag pattern, pointing to a retreat, even as it enters the stock and ETF trading industry.
Coinbase Is Facing Major Headwinds As It Expands to Stocks
Coinbase share price has retreated in the past few months as the management works to diversify its operations from the highly volatile crypto market.
In a statement, Brian Armstrong noted that the company was launching a stock trading platform as it works to become the world’s number one financial app. It is now offering tokenized stocks, allowing customers to trade equities 24/5.
Launching stock trading is an important step as the company aims to compete further with companies like Robinhood and WeBull. The service also enables customers from other countries to participate in the booming US equities market.
READ MORE: MSTR Stock Price: Top 3 Reasons Strategy May Crash to $100
Coinbase has also launched a new service to allow prediction markets on its platform, a notable development as this is one of the fastest-growing industries in the financial market.
These launches are part of Coinbase’s strategy to diversify its revenue streams. The most recent results showed that the transaction business made over $982 million in quarterly revenue, down from $1.5 billion in the same period in 2024. This retreat coincided with the crypto market crash, which led to a big dip in its volume.
The decline was offset by subscription and services revenue, which jumped to $727 million from $641 million. In total, the company announced a big loss of over $670 million in the fourth quarter, a trend that may continue in Q1 as Bitcoin and most coins have continued to fall.
Coinbase Stock Price Technical Analysis Points to a Steeper Crash
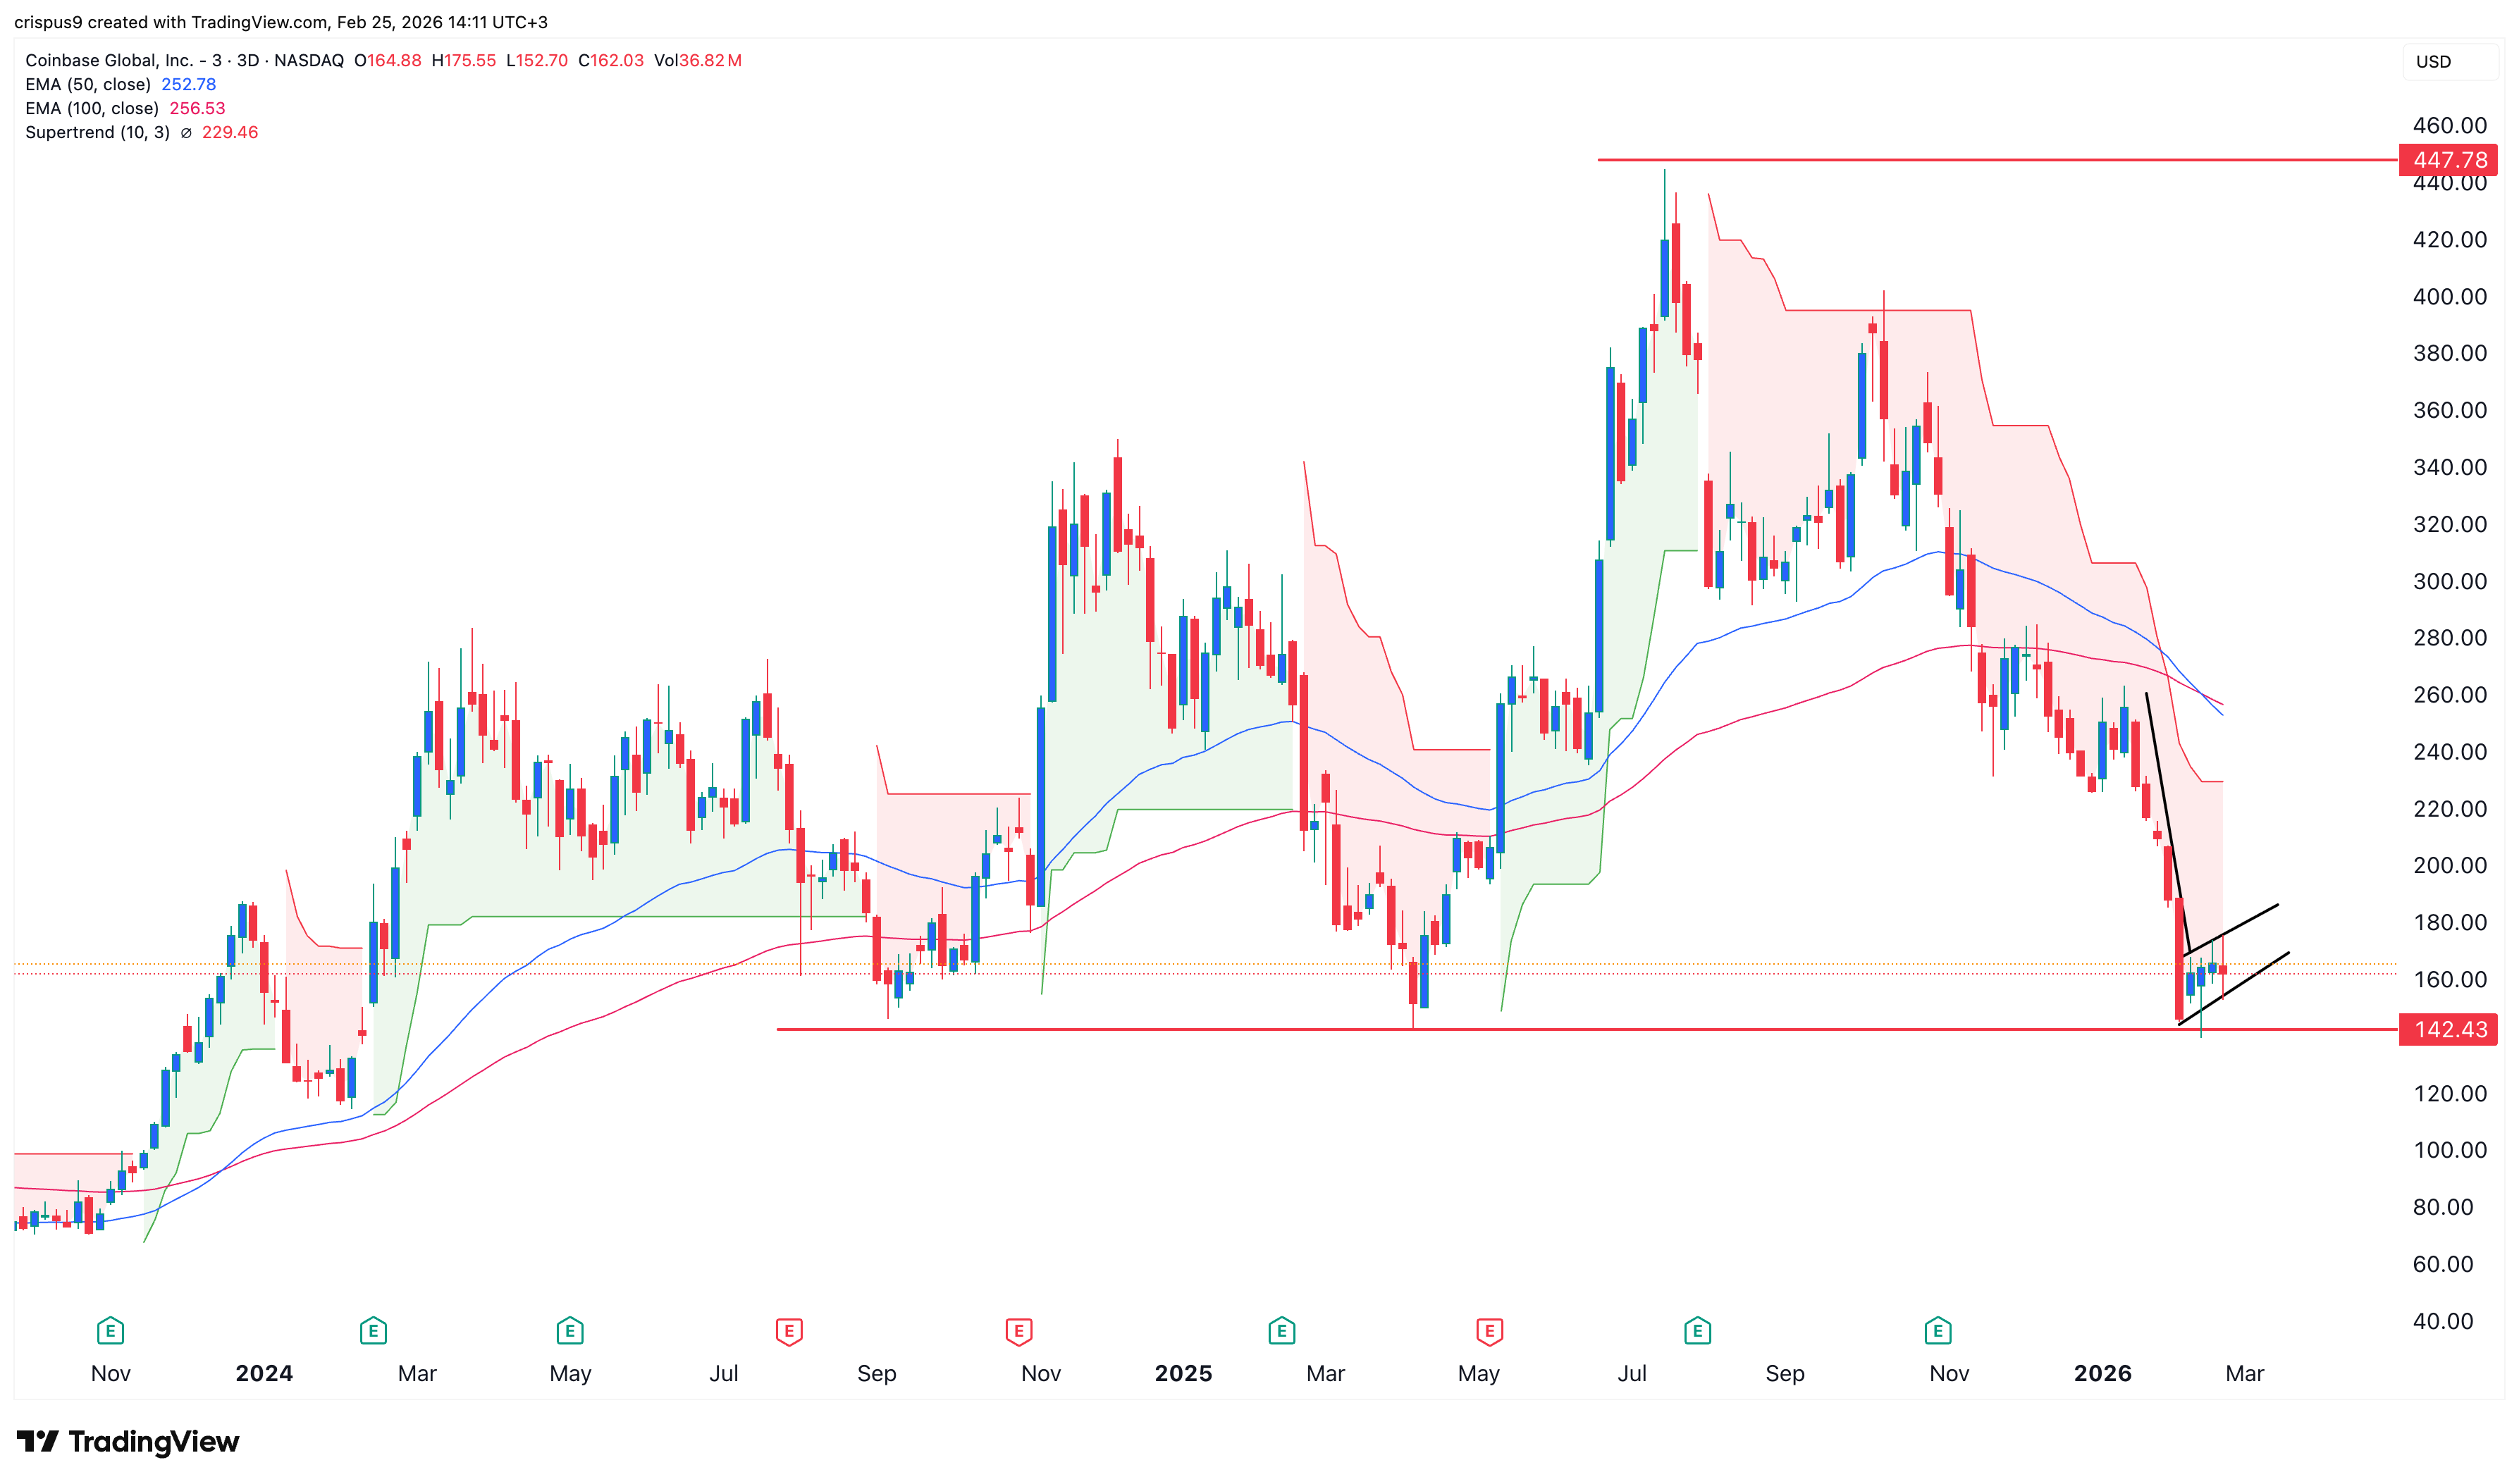
The three-day timeframe chart shows that the COIN stock price has been in a strong downward spiral in the past few months. It crashed from a high of $445 in July last year to the current $162.
The current level is important because it coincides with the lowest levels in September 2024 and April last year. It has remained below all moving averages and the Supertrend indicator. Most recently, it formed a mini-death cross when the 50-day and 100-day moving averages crossed.
At the same time, the stock is slowly forming a bearish flag pattern, consisting of a vertical line and consolidation. This pattern often leads to a bearish breakdown, which, in this case, will be confirmed if it drops below the key support level at $142.
Such a move could push the COIN stock to the key support level at $100, about 40% below its current level.
READ MORE: Here’s Why the Blue-Chip Dow Jones Index is Slumping and What Next