


XRP price has been moving sideways over the past few weeks. It has remained inside the key support level at $1.3350 and $1.5080 since February 6. It exited that range only on February 15, when it surged to $1.6717.
This article explores what to expect ahead of the upcoming US Consumer Price Index (CPI) and Personal Consumption Expenditure (PCE) data.
XRP Price to React to US CPI and PCE Inflation Numbers
Ripple price will be in the spotlight this week as the US releases the closely-watched inflation metrics, which will provide more information on price changes.
Data compiled by TradingEconomics shows that the headline Consumer Price Index (CPI) is expected to come in at 2.5%, a small increase from the previous month’s 2.4%. Core inflation, which excludes the volatile food and energy prices, is expected to come in at 2.5%.
READ MORE: BitMine Stock Price Forecast: Here’s Why BMNR is Ripe For a Breakout
The other important inflation report will be the January PCE report. PCE is an important report because it is the Federal Reserve’s preferred inflation gauge, as it measures inflation in both urban and rural areas. Economists expect the upcoming report to show that the headline PCE rose 2.9% in January, while the core PCE rose to 3.1%.
These inflation numbers come a few days after the US released weak non-farm payrolls (NFP) data. These numbers revealed that the economy lost 92,000 jobs in February as the unemployment rate ticked upwards to 4.4%.
While the inflation report is important, its impact will be limited by the ongoing war in Iran, which has pushed crude oil prices to their highest level in years.
Brent and West Texas Intermediate (WTI) are expected to surge above $100 when the market opens. This trend will continue as the crisis in the Middle East continues.
These events are unfolding as key XRP metrics deteriorate. For example, data shows that spot XRP ETFs shed over $26 million in assets on Friday after losing $6.15 million on Thursday.
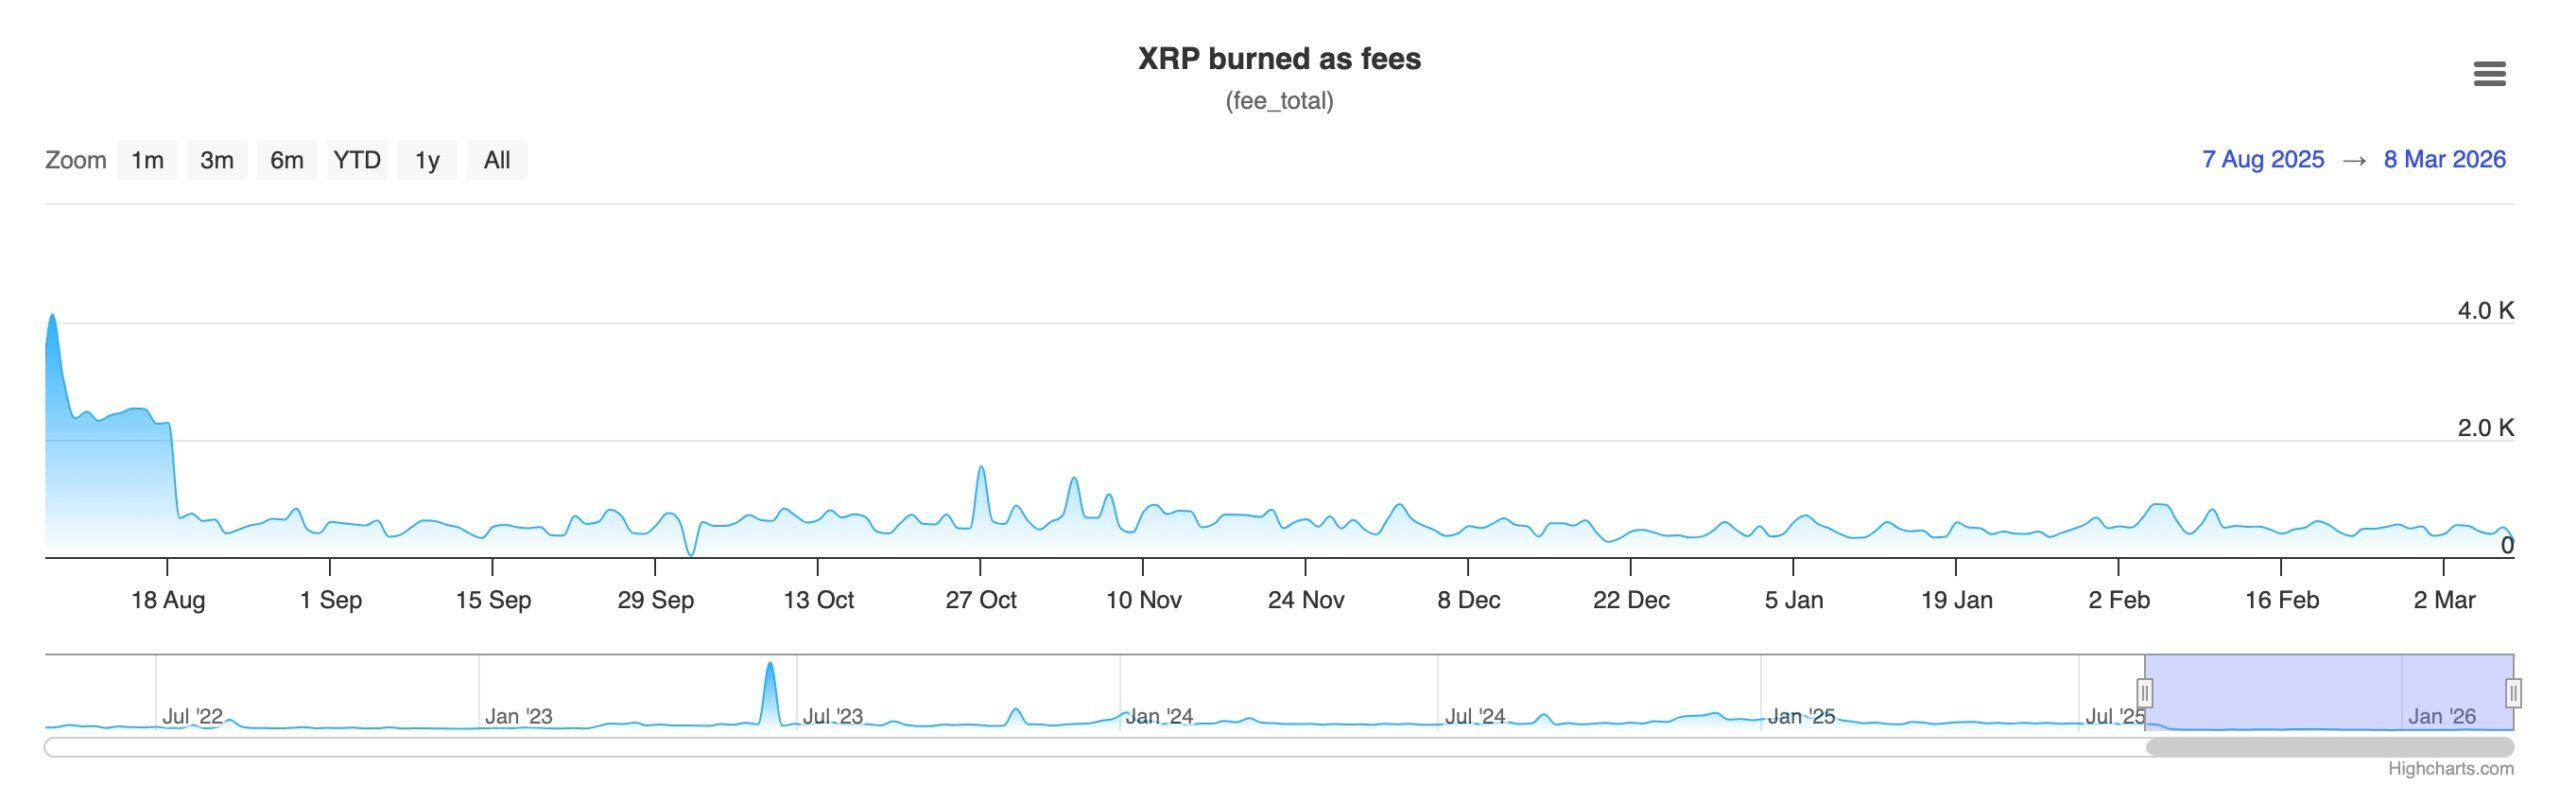
Additionally, the XRP burn rate has tumbled. Only 258 XRP tokens were burned on Sunday as transactions dropped to 1.2 million, down from last month’s high of 3.56 million.
Ripple Price Technical Analysis

The weekly chart shows that the Ripple price has crashed in the past few months, falling from a high of $3.6791 in July last year to the current $1.3450.
It has plunged below the 61.8% Fibonacci Retracement level, confirming the bearish outlook. The Relative Strength Index (RSI) has moved downwards and is nearing the oversold level of 30.
The XRP token has remained below the 50-day Exponential Moving Average (EMA). It also moved below the Major S&R Pivot Point of the Murrey Math Lines tool.
Therefore, the token will likely continue falling, with the next key target being the psychological $1.0 level.
READ MORE: Pi Network Coin Flips Key Price After OpenMind Case Study Breakthrough