


Bitcoin price remained relatively stable on Monday, despite a decline in global stock markets and a surge in crude oil prices, reaching its highest levels in years. Bitcoin rose to $67,722, up slightly from a day’s low of $65,000. This article explores the potential reasons why a rally in Bitcoin and the broader crypto market may occur soon.
Stock Market Crash and Soaring Crude Oil Price May Push Trump to Capitulate
The stock market crashed on Monday, with popular indices like the Kospi, Nikkei 225, and the Dow Jones falling by over 3%. Also, American stock futures like the S&P 500 and the Dow Jones retreated by over 2% before paring back some of those losses.
The stock market crash accelerated after crude oil and natural gas prices continued soaring.
Brent, the global benchmark, jumped to $119 and then pulled back to $105. Similarly, the West Texas Intermediate (WTI) rose to $116 and then retreated to $102.50.
On the positive side, the ongoing price action could be a bullish sign for Bitcoin and the broader crypto market.
That’s because Donald Trump watches closely the stock market, energy prices, and approval ratings. As such, while he has put on a brave face, there is a likelihood that the president will capitulate and start ending the war.
READ MORE: Top Crypto Stock Stocks to Watch This Week: SharpLink, Circle, MSTR, BitMine
In this case, Trump may argue that the United States has achieved its mission by eliminating Ayatollah Ali Khamenei and other senior leadership. Also, the country has destroyed most of the Iranian navy and ballistic missiles.
As a result, he may soon announce the end of the war in his bid to boost the stock market and his polling numbers. A good example of this is what happened last year when he announced the imposition of tariffs, leading to a crash in stock and bond markets.
At the time, he announced that he would delay implementing the reciprocal tariffs and start negotiating with other countries, which boosted the stock and crypto markets. The same may happen as soon as this week.
Bitcoin Price Prediction: Technical Analysis
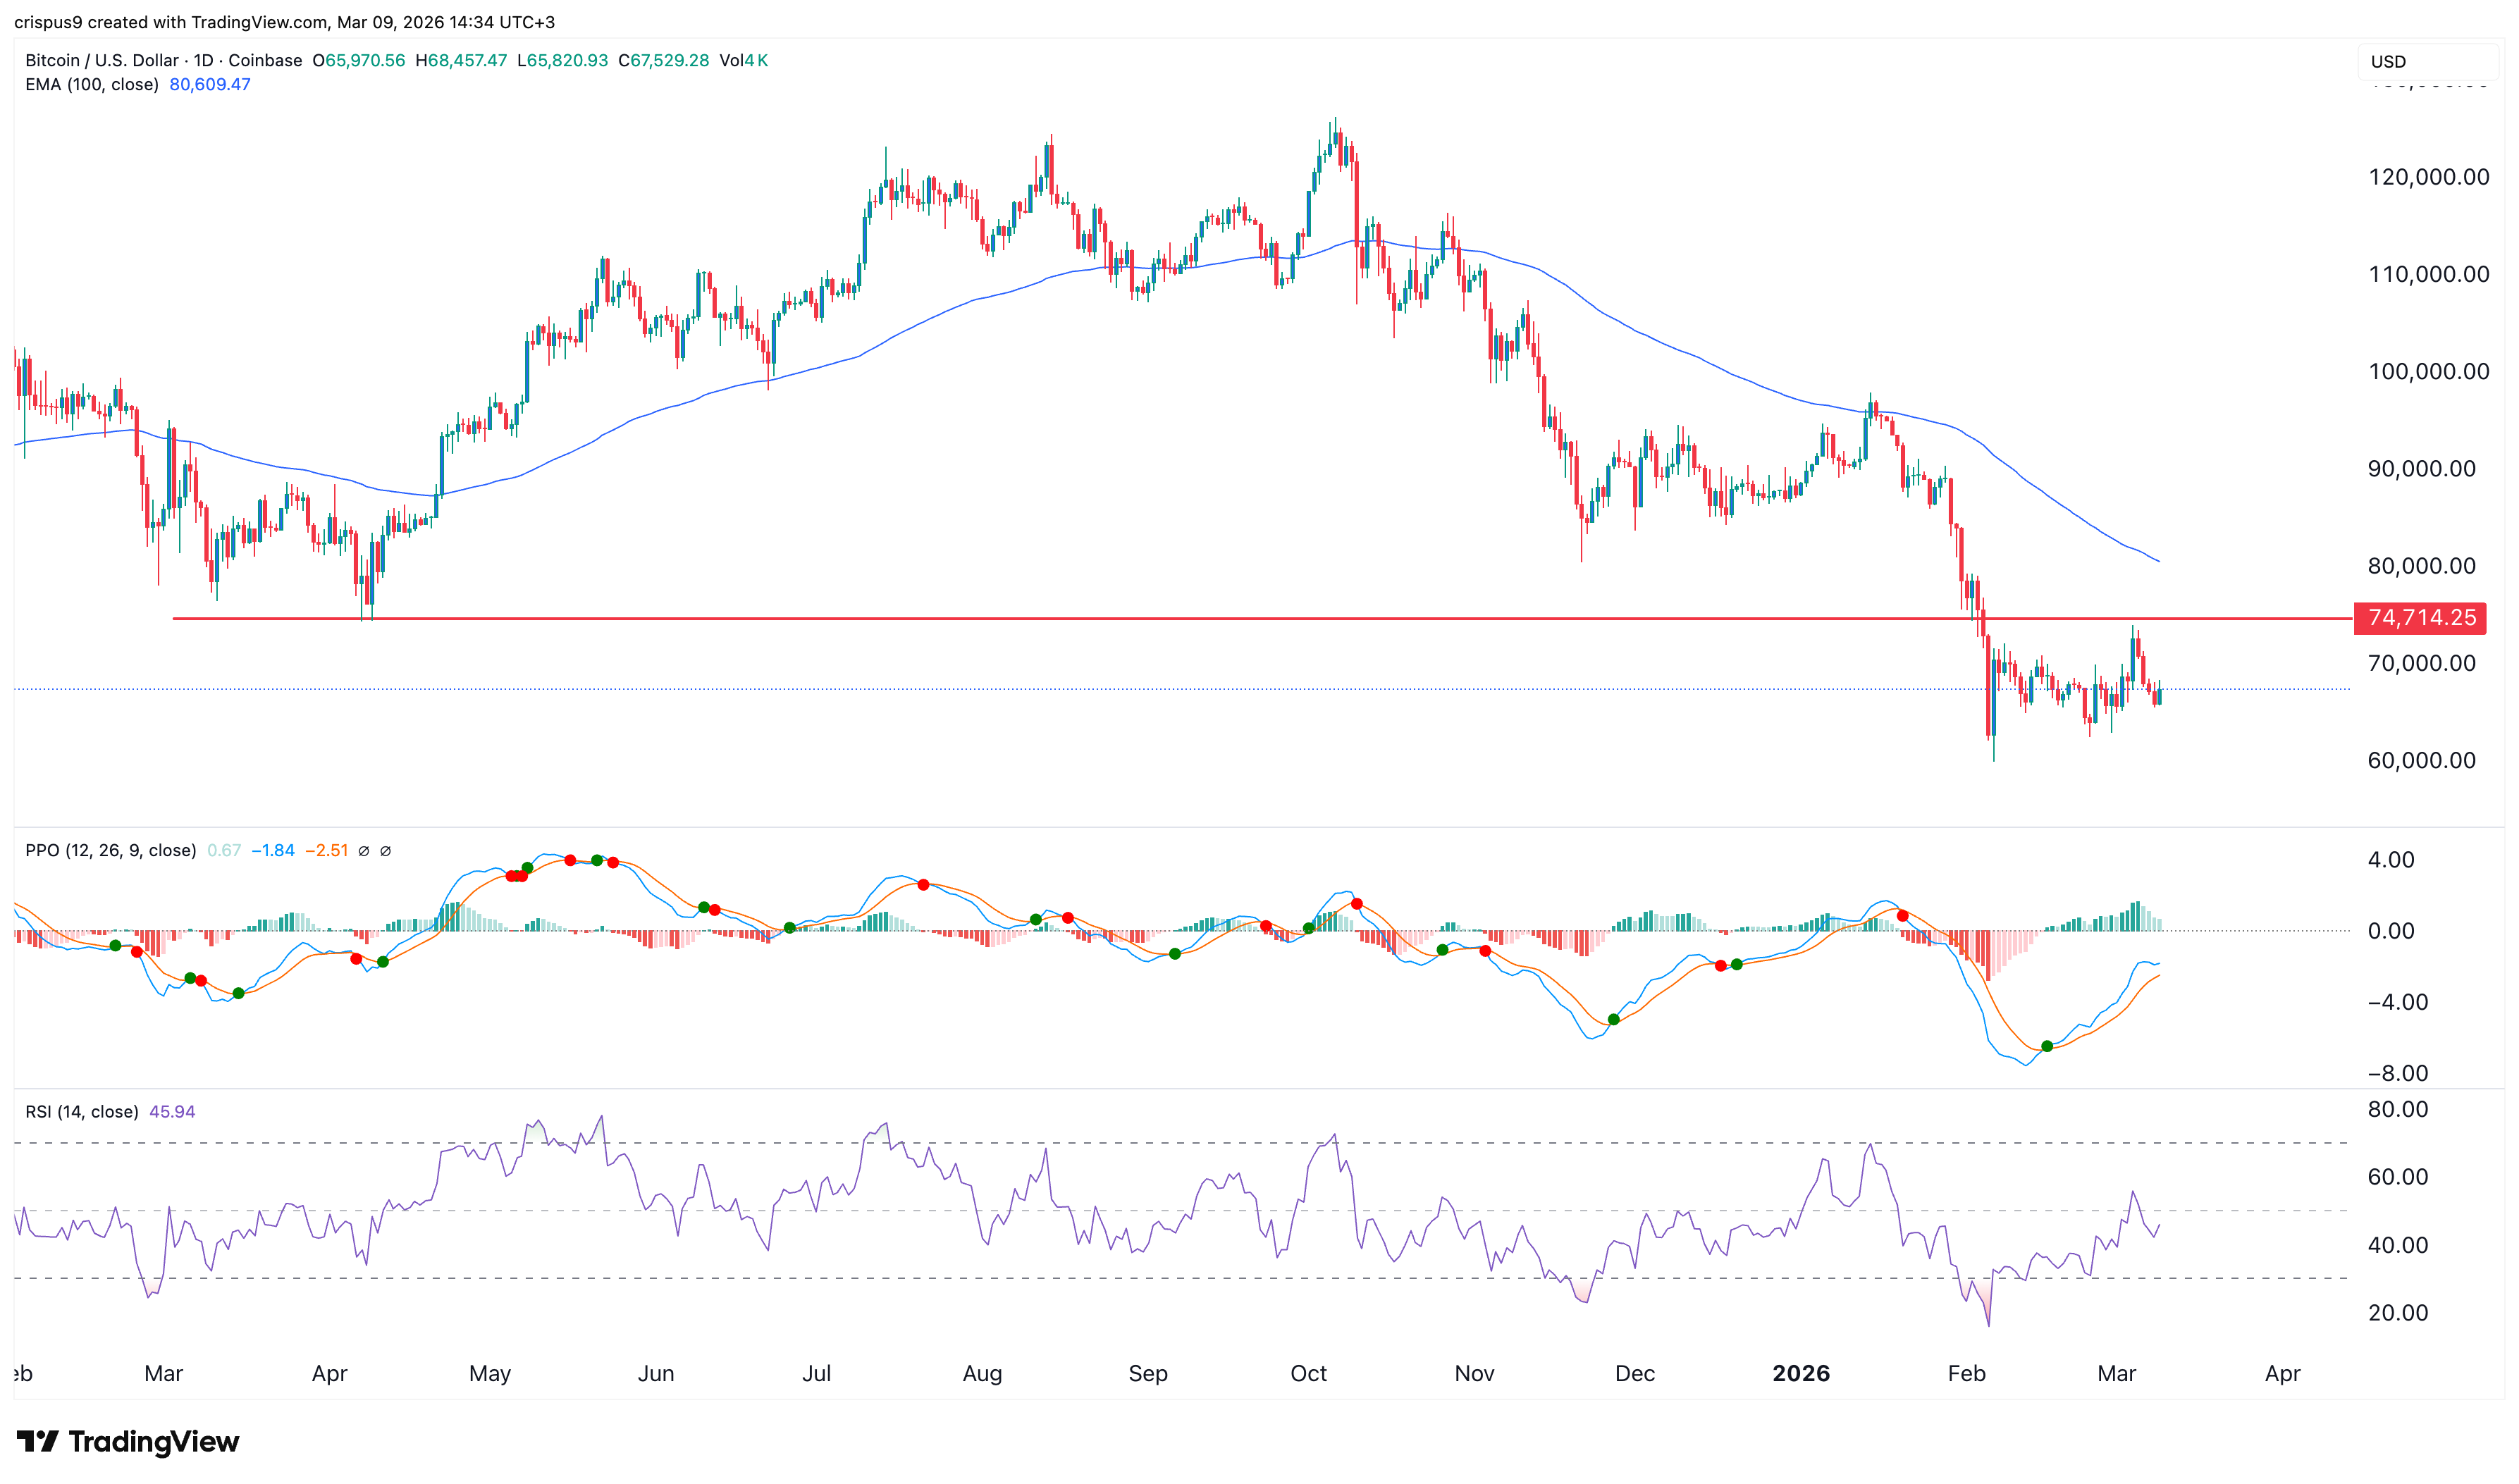
The daily timeframe chart shows that the Bitcoin price has remained in a tight range since February this year. It has remained inside the key support level at $60,000 and the resistance at $73,893.
The coin has formed a bullish divergence pattern, as the Relative Strength Index (RSI) and the Percentage Price Oscillator (PPO) have continued to rise over the past few weeks.
Therefore, the most likely scenario is where the coin rebounds in the near term. A bullish breakout will be confirmed if it moves above the key $74,715 resistance level. A move above that level will signal further gains, potentially to the psychological $80,000 level and beyond.
READ MORE: Pi Network Coin Flips Key Price After OpenMind Case Study Breakthrough