


- Robinhood stock price has formed bearish technicals.
- It has formed a bearish flag pattern, pointing to a drop to $50.
- Its fundamentals, including rising revenues, are highly supportive.
Robinhood stock price remained unchanged this week despite some notable highly bullish catalysts. HOOD was trading at $75 on Wednesday, within a range it has been stuck in over the past few days. This price is about 51% below its highest point last year. It has formed a risky pattern, pointing to further downside.
Robinhood Stock Price Chart Signals Further Downside
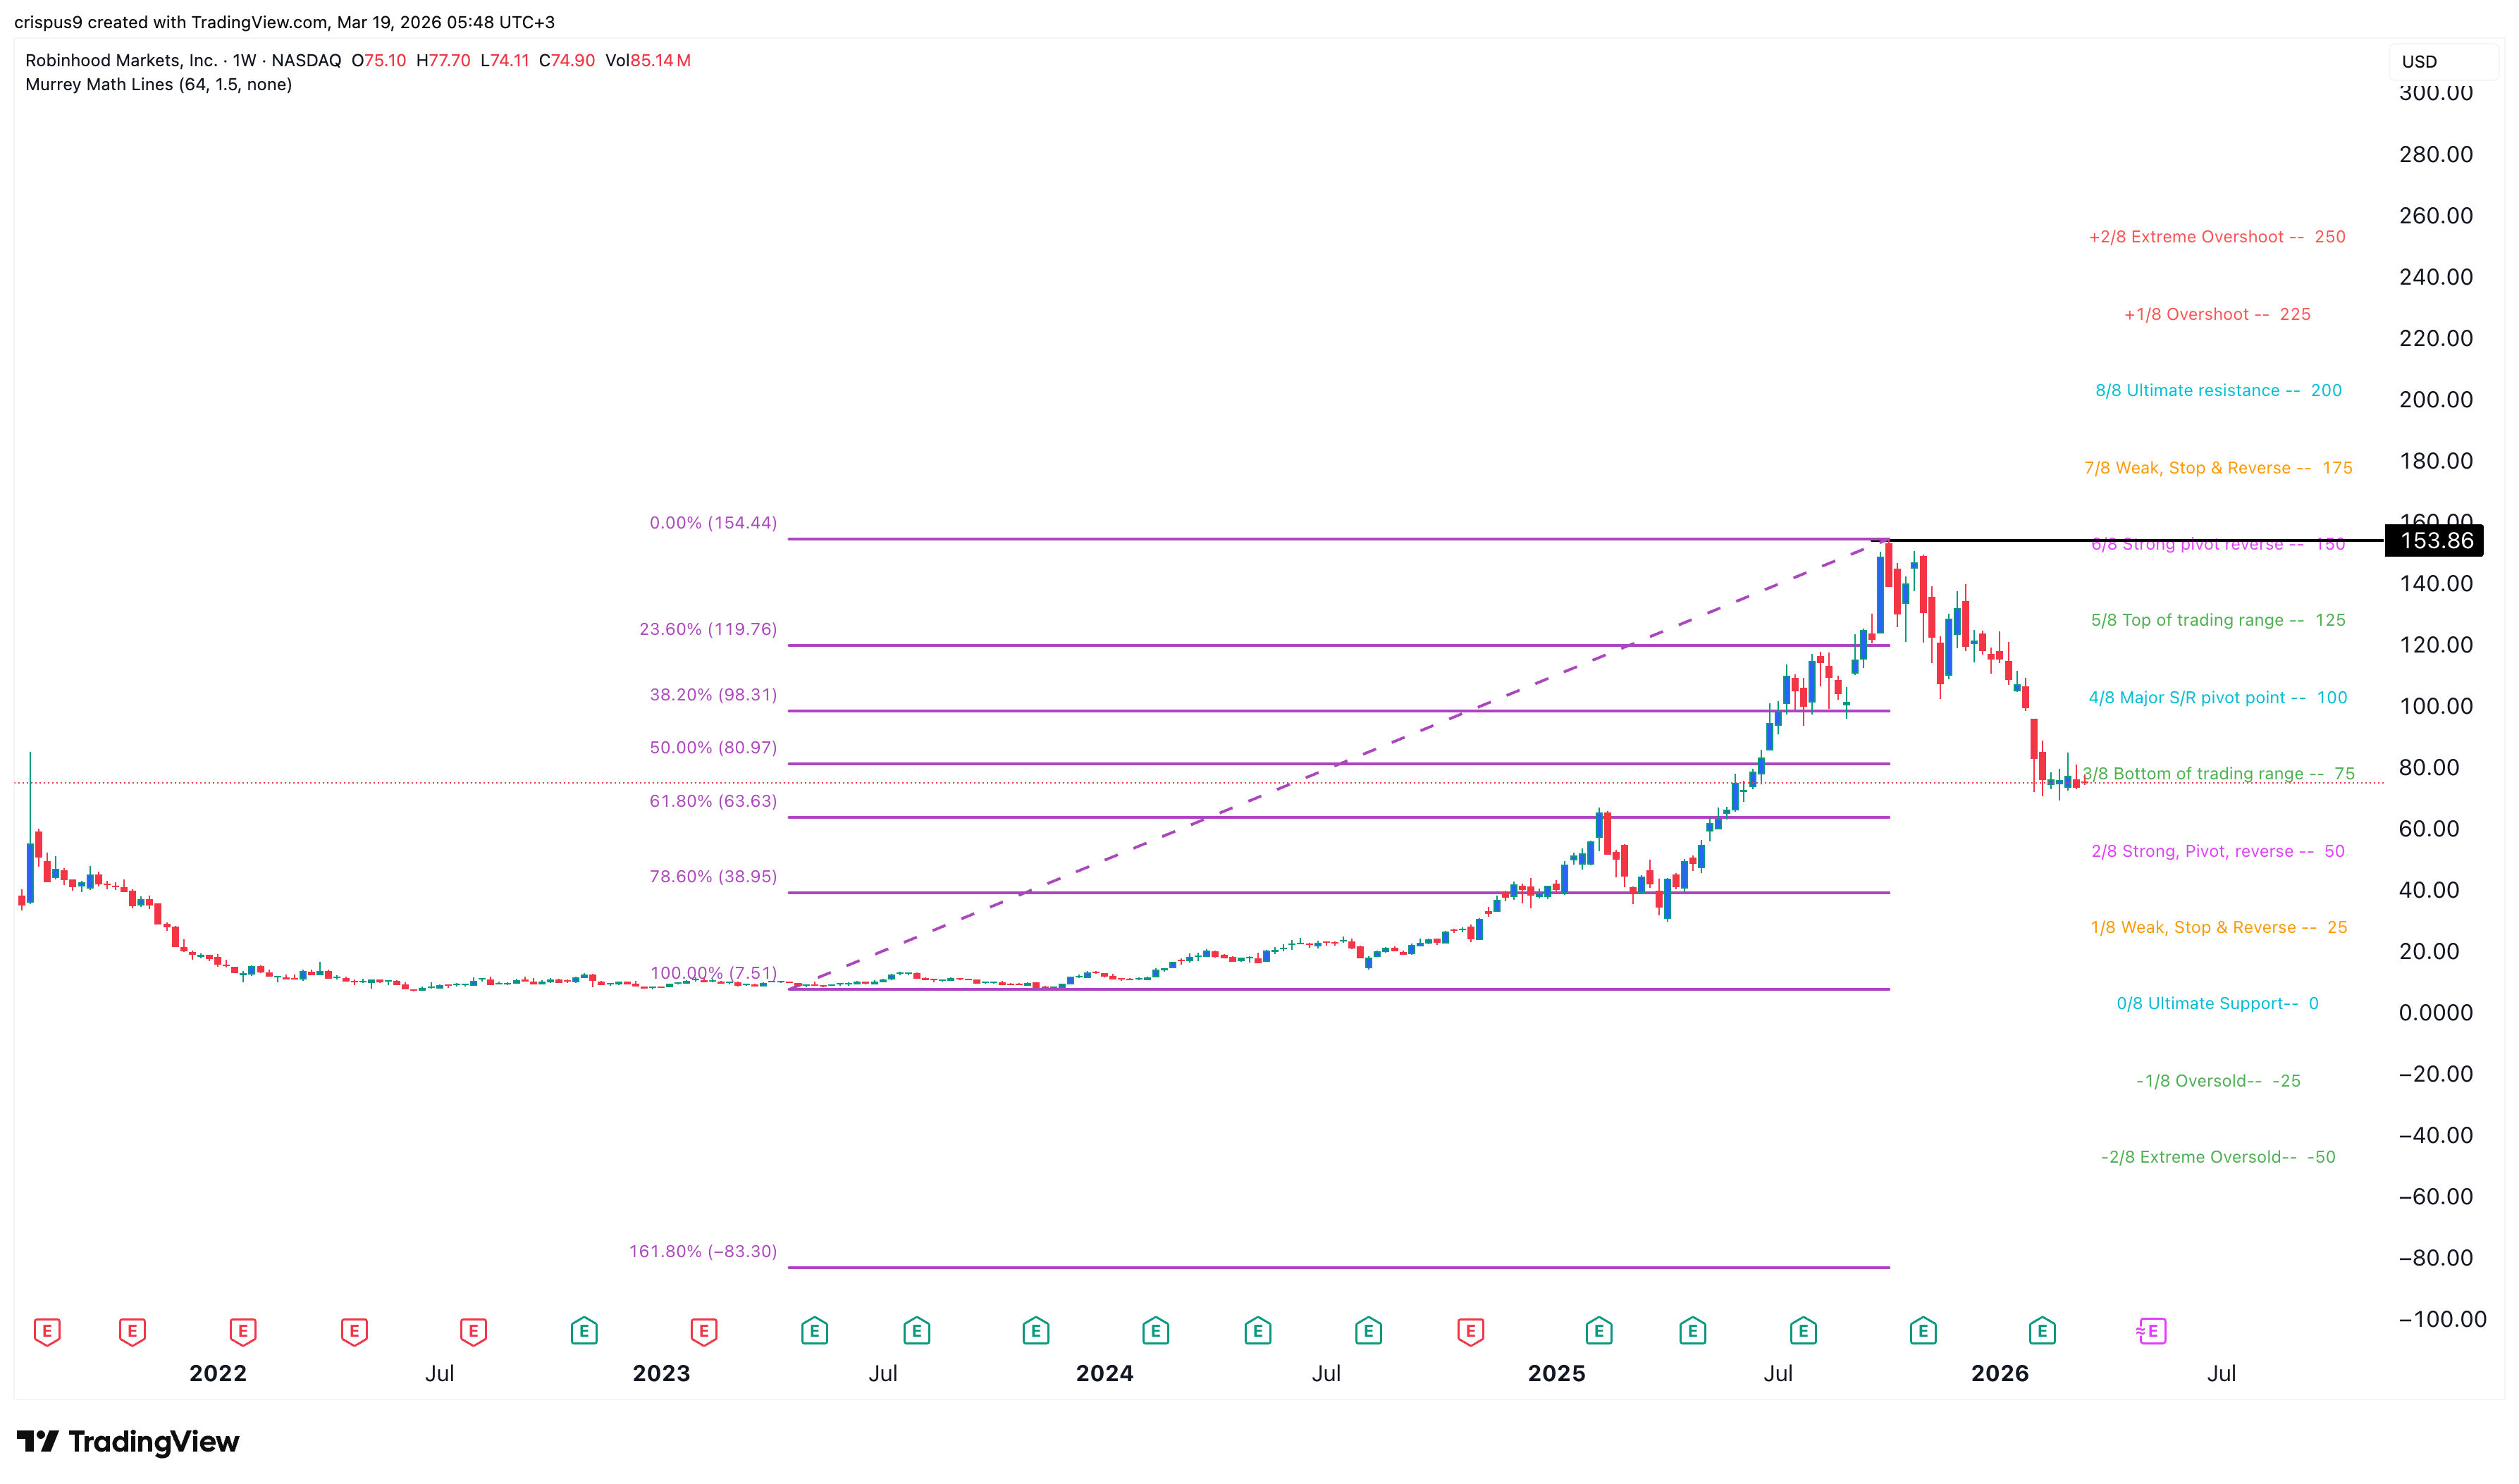
The weekly chart shows that HOOD’s stock price has slumped over the past few months. This retreat has erased some of the gains made last year when it was added to the S&P 500 Index.
The chart shows that the stock has dropped below the 50% Fibonacci Retracement level at $80. This Fibonacci is drawn by connecting the lowest and highest levels on record.
The stock has now formed a bearish flag pattern. This pattern consists of a vertical line and consolidation. In most cases, this pattern often leads to a strong bearish breakout over time.
READ MORE: Coinbase Stock Price Eyes a 40% Surge as Key Catalysts Emerge
It has moved below the Major S&R Pivot Point of the Murrey Math Lines tool and the 50-week and 100-week Exponential Moving Averages (EMA). Therefore, the stock will likely have a strong bearish breakout, potentially to the Strong, Pivot, and Reverse level of the Murrey Math Lines at $50.
On the other hand, a rebound above the key resistance level at $100 will invalidate the bearish outlook.
Robinhood’s Business is Doing Well
While the HOOD stock price forecast is bearish, the company has some solid fundamentals, helped by its innovation. For example, the company launched Social, a product that allows users to track and copy other traders.
The company has also made a banking push, with its newly launched solution attracting over $1 billion in deposits in less than four months. Most recently, it launched a platinum card, which costs $650 a year and competes with those issued by companies like JPMorgan and American Express.
Additionally, the company will likely benefit from the ongoing stabilization of crypto prices. The Bitcoin price has jumped by about 20% from its lowest level this year. Other top altcoins like Solana and XRP have also risen, while spot ETF inflows have continued rising.
Broadly, analysts expect that Robinhood’s business will continue rising this year. Its revenue is expected to bounce by 35% this quarter to over $1.25 billion, with the most optimistic analyst forecasting it will reach $1.4 billion. The annual revenue is expected to jump by 22% to $5.45 billion.
The company has become a bargain compared to where it was trading last year. Its forward price-to-earnings (PE) ratio moved to 30.65, down substantially from last year’s high of over 60. The Rule-of-40 metric shows it is cheap, with a net income margin of 41% and forward revenue growth of 22%, giving it a multiple of 63%.
Therefore, there are signs that technicals and fundamentals are sending mixed signals. While technicals recommend shorting the company, fundamentals suggest it has more upside. In this case, chances are technicals will prevail initially, and the stock will rebound afterwards.
READ MORE: Nebius Stock Price Crashed 10%: Top Reasons NBIS Will Rebound Soon