


- Solana price retreated as SOL ETF outflows continued this week.
- Nansen data shows that the number of transactions has continued falling this week.
- The coin has formed a bearish flag chart pattern on the daily timeframe chart.
Solana price retreated on Saturday as the geopolitical tensions and SOL ETF outflows gained steam. SOL token also dropped as activity in the network continued retreating. It has now dropped by ~70% from its highest point this year.
Solana ETF Outflows Rise as Network Activity Dries
SOL price has moved sideways since the first week of February as the crypto market crash has intensified, with Bitcoin and most altcoins remaining in the red.
This performance is happening because of the ongoing Iran war that has pushed investors away from the market as fear rose. The Crypto Fear and Greed Index has remained in the fear zone in the past few weeks.
Data shows that Solana’s demand from American investors has largely dried. These funds shed over $4.24 million in assets this week, bringing the cumulative net inflows since their inception to over $985 million.
These funds now hold over $809 million in assets under management, with the biggest ones being from companies like Bitwise, Grayscale, Fidelity, and VanEck.
READ MORE: MARA Stock Forms an Alarming Pattern as it Sells Bitcoin Amid AI Pivot
More data shows that Solana’s network activity has dropped substantially in the past few weeks. Per Nansen, the number of transactions dropped by 3.2% to 2.6 billion in the last 30 days. In contrast, Polygon’s transactions jumped by 38% in the same period.
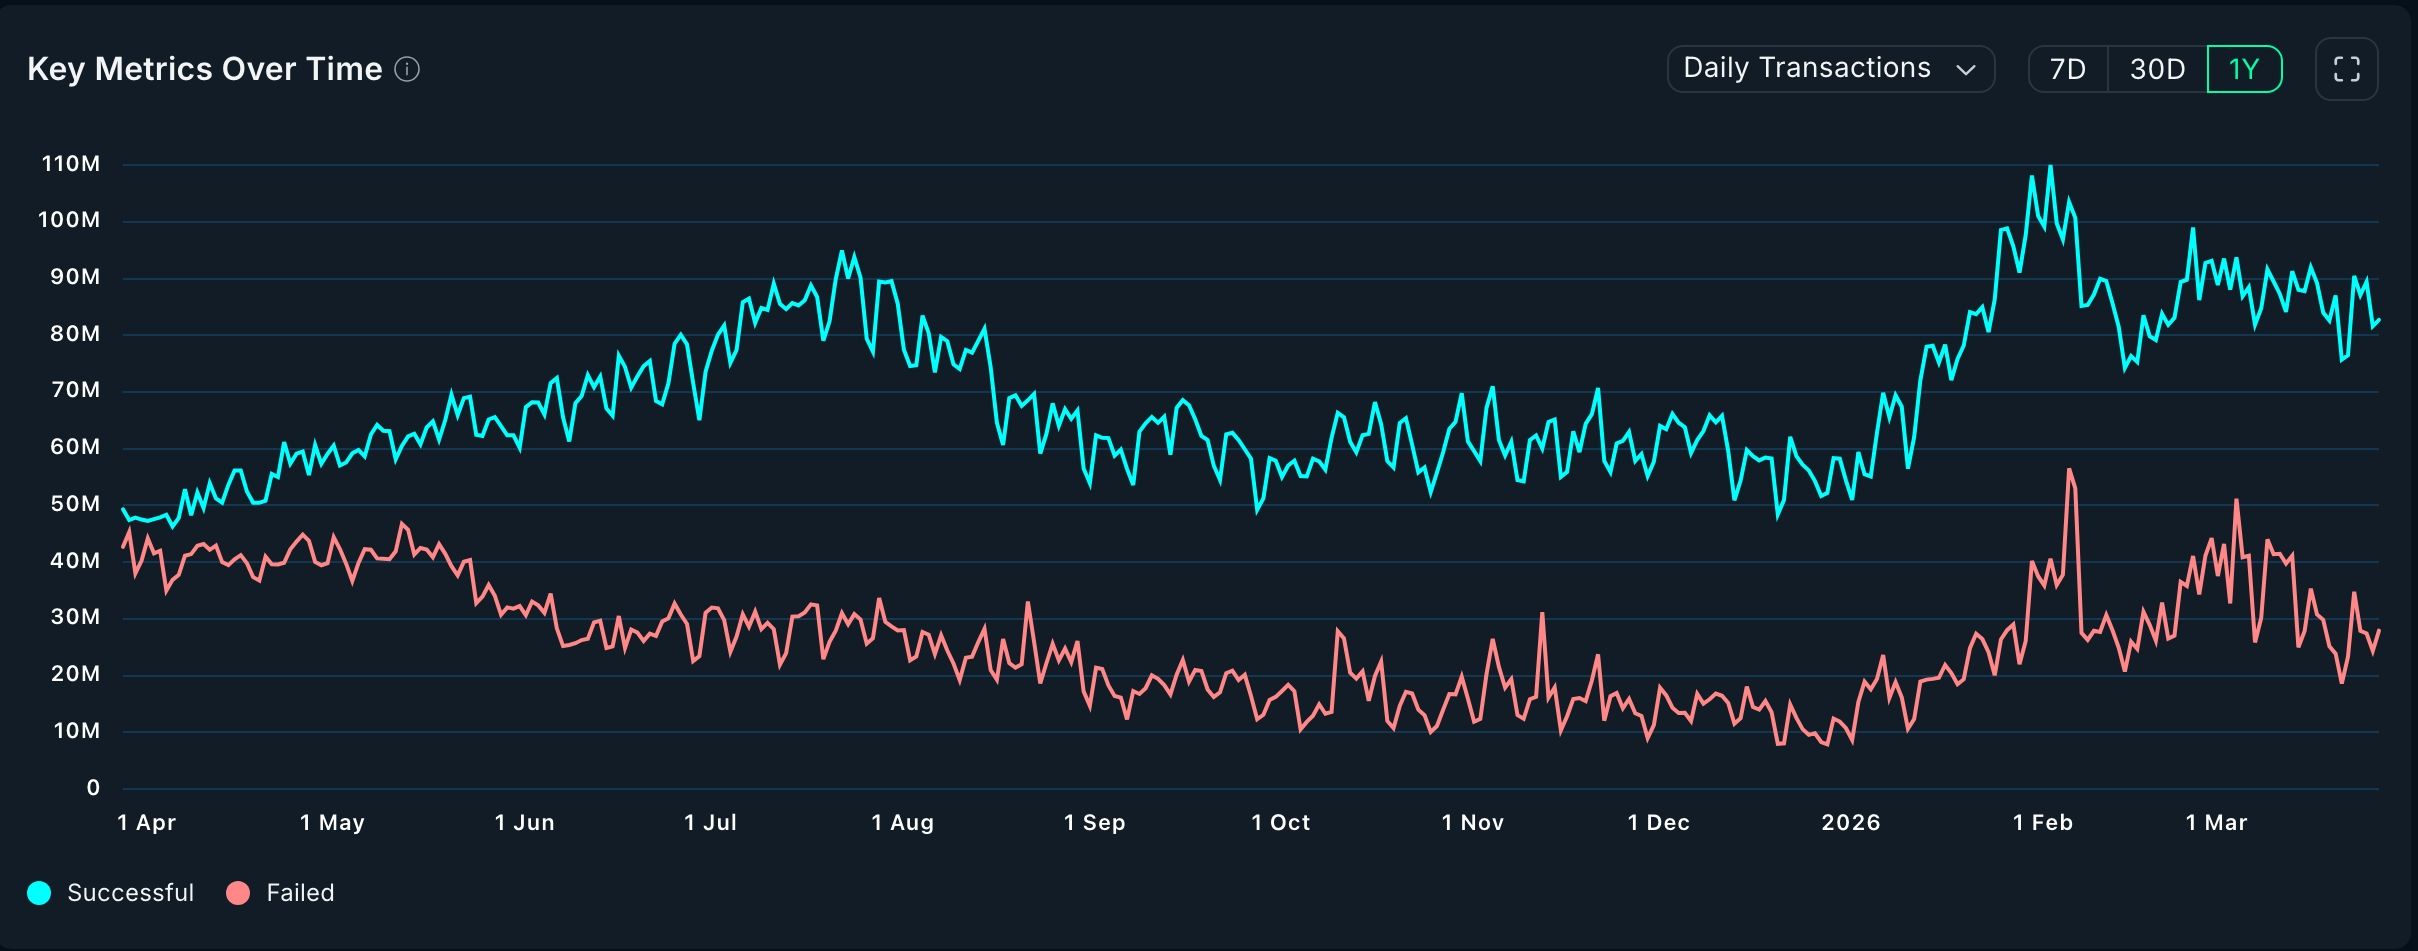
Solana’s active addresses dropped by 11% to 101 million, while the total fees collected by the network dropped by 31% in the same period. This is a major reversal as the network has constantly been one of the fastest-growing in the industry.
More Solana metrics show that Solana is losing momentum, with the stablecoin supply falling to over $16.5 billion and the adjusted volume falling to $608 billion. This volume was over $800 billion a few months ago.
Solana price has also wavered amid falling demand in the futures market. Data shows that the futures open interest has dropped to $5.4 billion, down from last year’s high of over $16.5 billion.
Solana Price Bearish Flag Pattern Points to a Dive
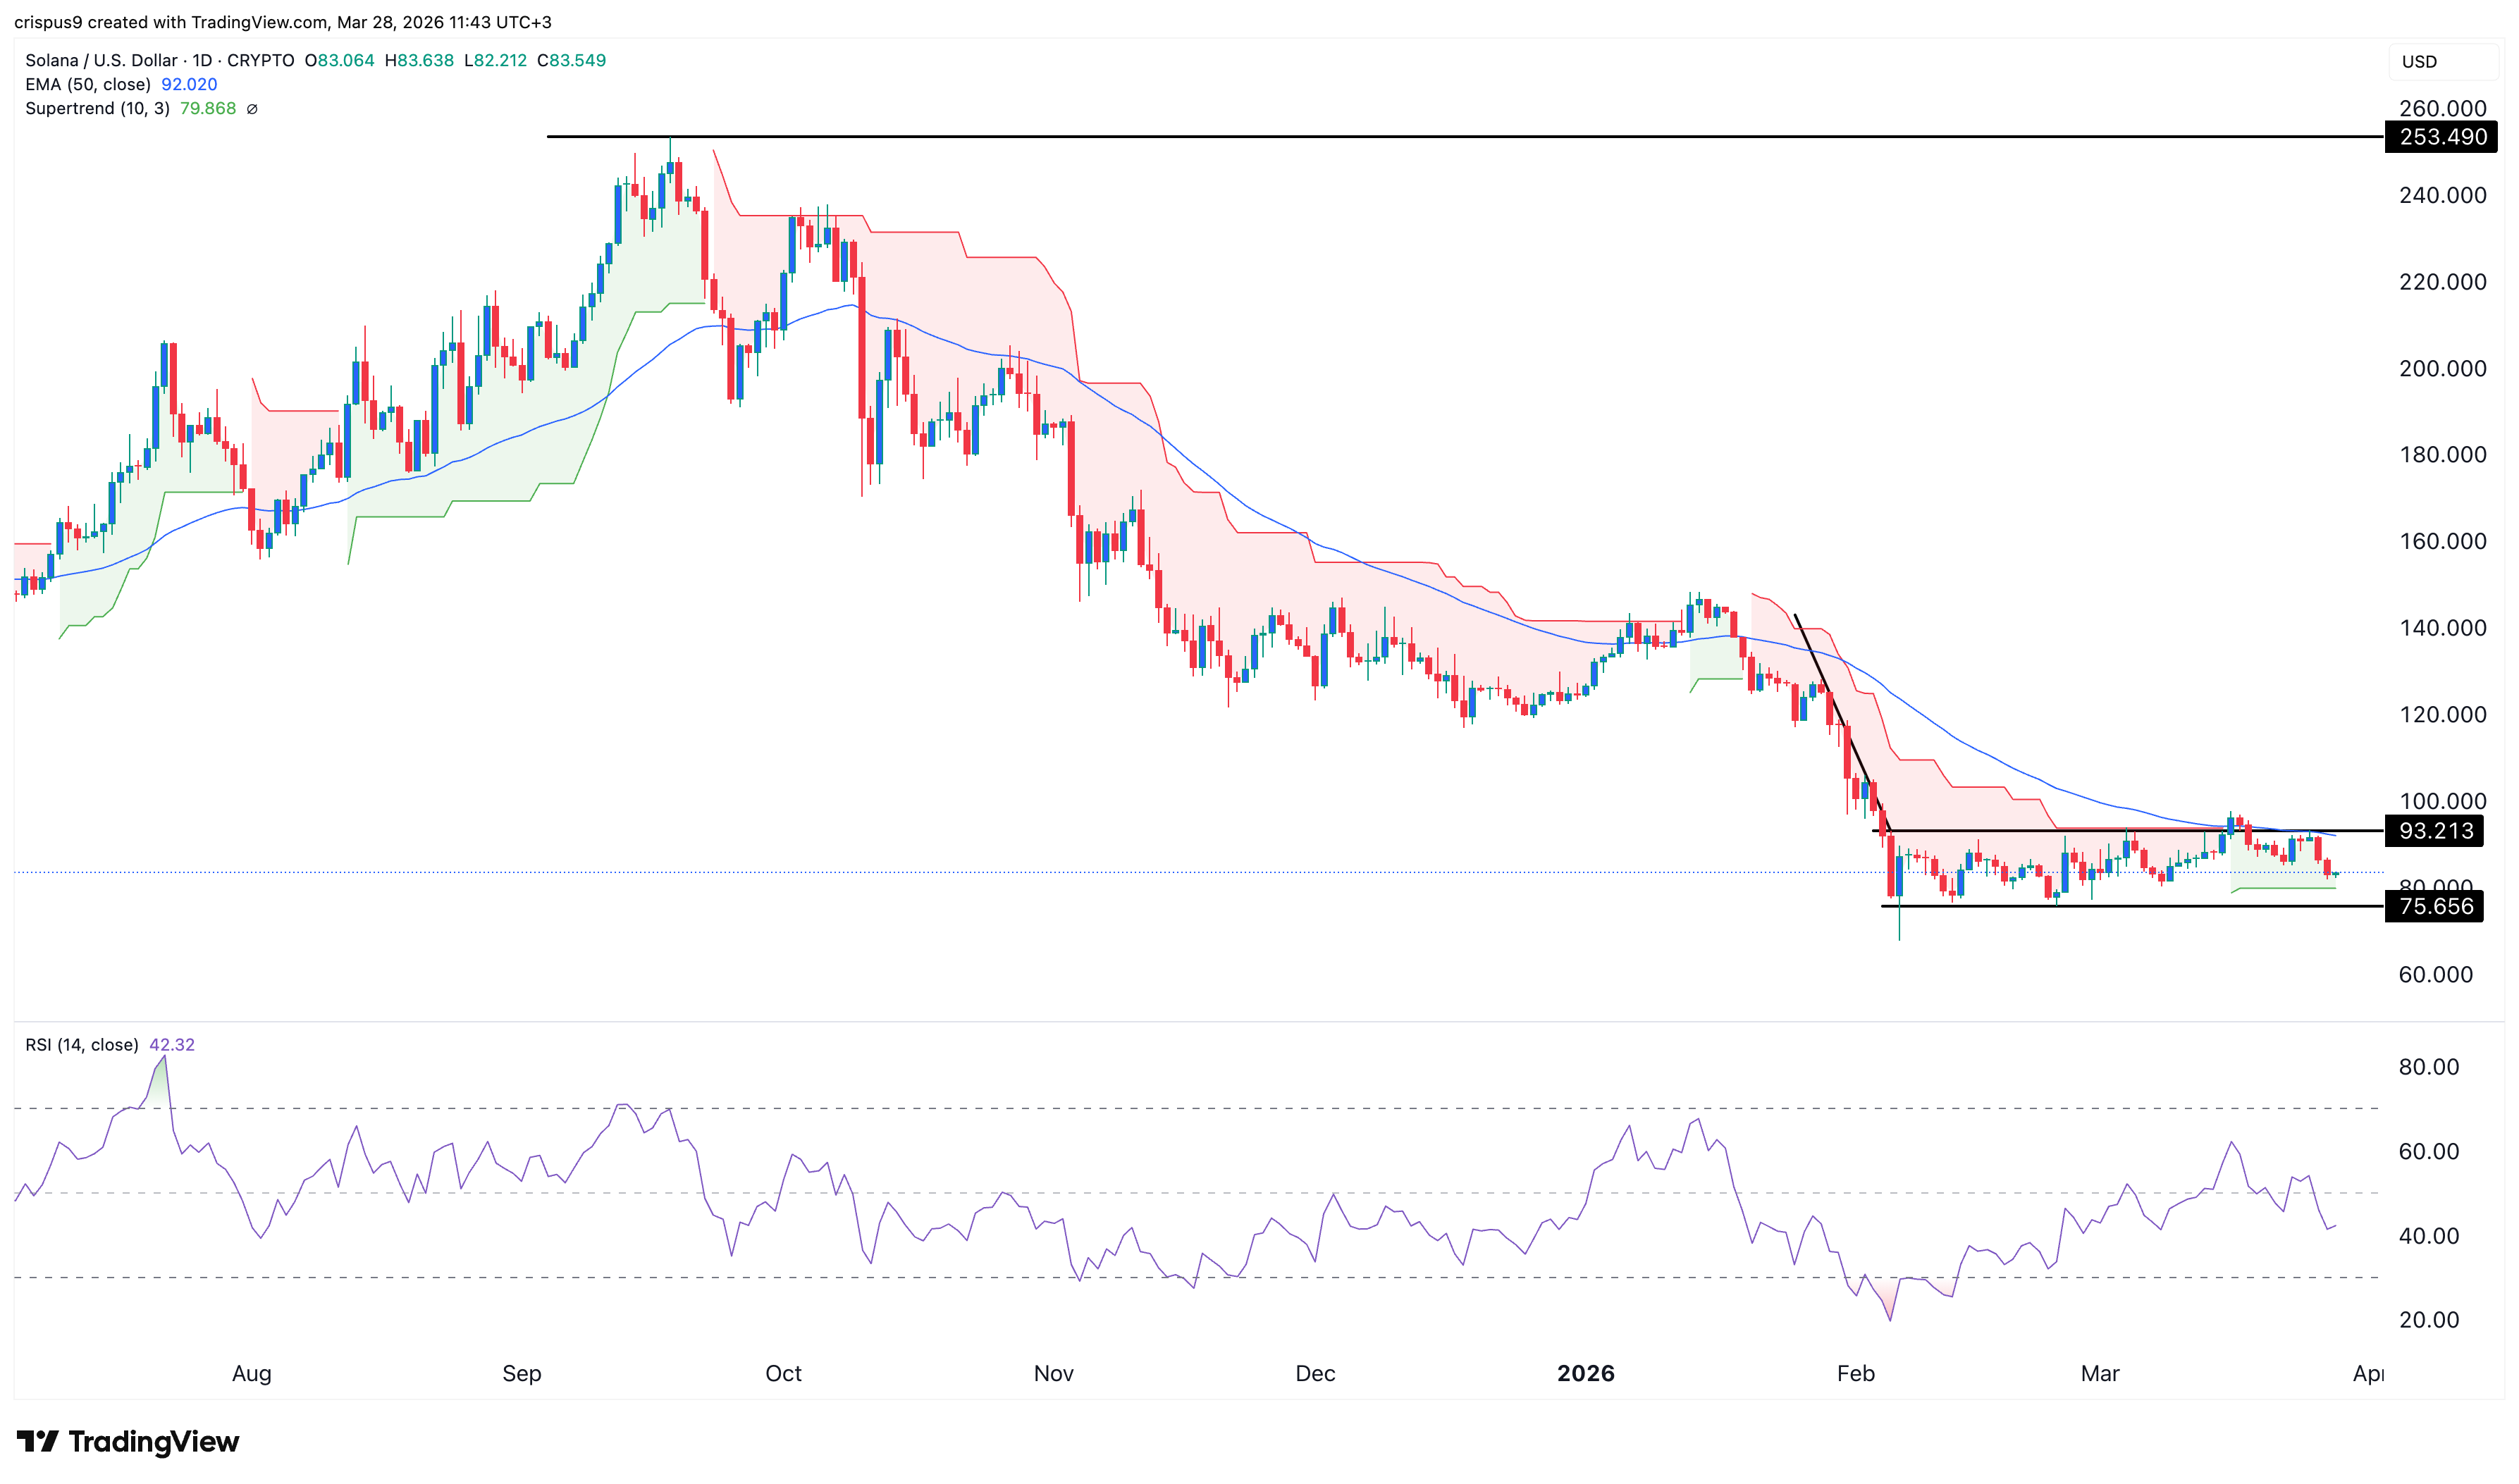
Technical analysis suggests that the SOL price may be on the verge of a strong bearish breakdown in the coming weeks or days. It has formed a large bearish flag pattern, which is made up of a vertical line and a horizontal channel. It is now in the channel section.
Solana price has remained below the 50-day and 100-day Exponential Moving Averages (EMA) and the Supertrend indicator. Also, the Relative Strength Index (RSI)has slipped below the neutral point at 50.
Therefore, Solana token will likely continue falling in the coming days or weeks. The initial target will be the year-to-date low of $75. A move below that level will point to more downside, potentially to the psychological level at $50.
On the other hand, a move above the resistance level at $93.5 will invalidate the bearish outlook and point to more gains in the coming weeks or months.
READ MORE: SPY and VOO Stocks Eye Bear Market as Fear and Greed Index Hits 10