


- Pepe Coin price remained in a tight range on Thursday.
- Canary Capital filed for a new spot PEPE ETF with the SEC.
- The fund, if approved, the fund will likely have minimal inflows.
Pepe Coin price remained in a narrow range this week, even after a major development from Canary Capital, which applied for a spot exchange-traded fund (ETF). It was trading at $0.0000035, inside a range it has remained since February. This price is about 80% below the May 2021 high.
Canary Capital Files for PEPE ETF
Pepe Coin price wavered as investors reacted to the latest filing for a spot PEPE ETF. If approved, it will be the first fund to track the second-largest Ethereum meme coin in the industry.
The token’s reaction was muted because of the ongoing underperformance of moss altcoin ETFs. For example, while Dogecoin is the world’s biggest meme coin, demand for its ETFs has faded.
The Grayscale, 21Shares, and Bitwise Dogecoin ETFs have had no inflows since March 16. The three funds have now accumulated $7.6 million in inflows, bringing the total assets to $9.32 million, which is just 0.07% of the market capitalization.
READ MORE: Crypto Rally at Risk as Odds of 25th Amendment and Democrats Flipping Senate Rise
Similarly, the Canary Litecoin ETF holds just $6.15 million in assets, while the recently launched spot Polkadot ETF has seen just one day of inflows since its March launch. It now holds about $10 million in assets, 0.47% of its market capitalization.
Therefore, the spot PEPE ETF may not be popular among analysts and investors. Besides, data shows that the meme token is no longer as popular as it was a few years ago.
For example, CoinGlass data shows that its 24-hour volume was just $324 million, well below Dogecoin’s $1.3 billion. Its futures open interest has also continued falling this year.
Pepe Coin Price Prediction: Technical Analysis
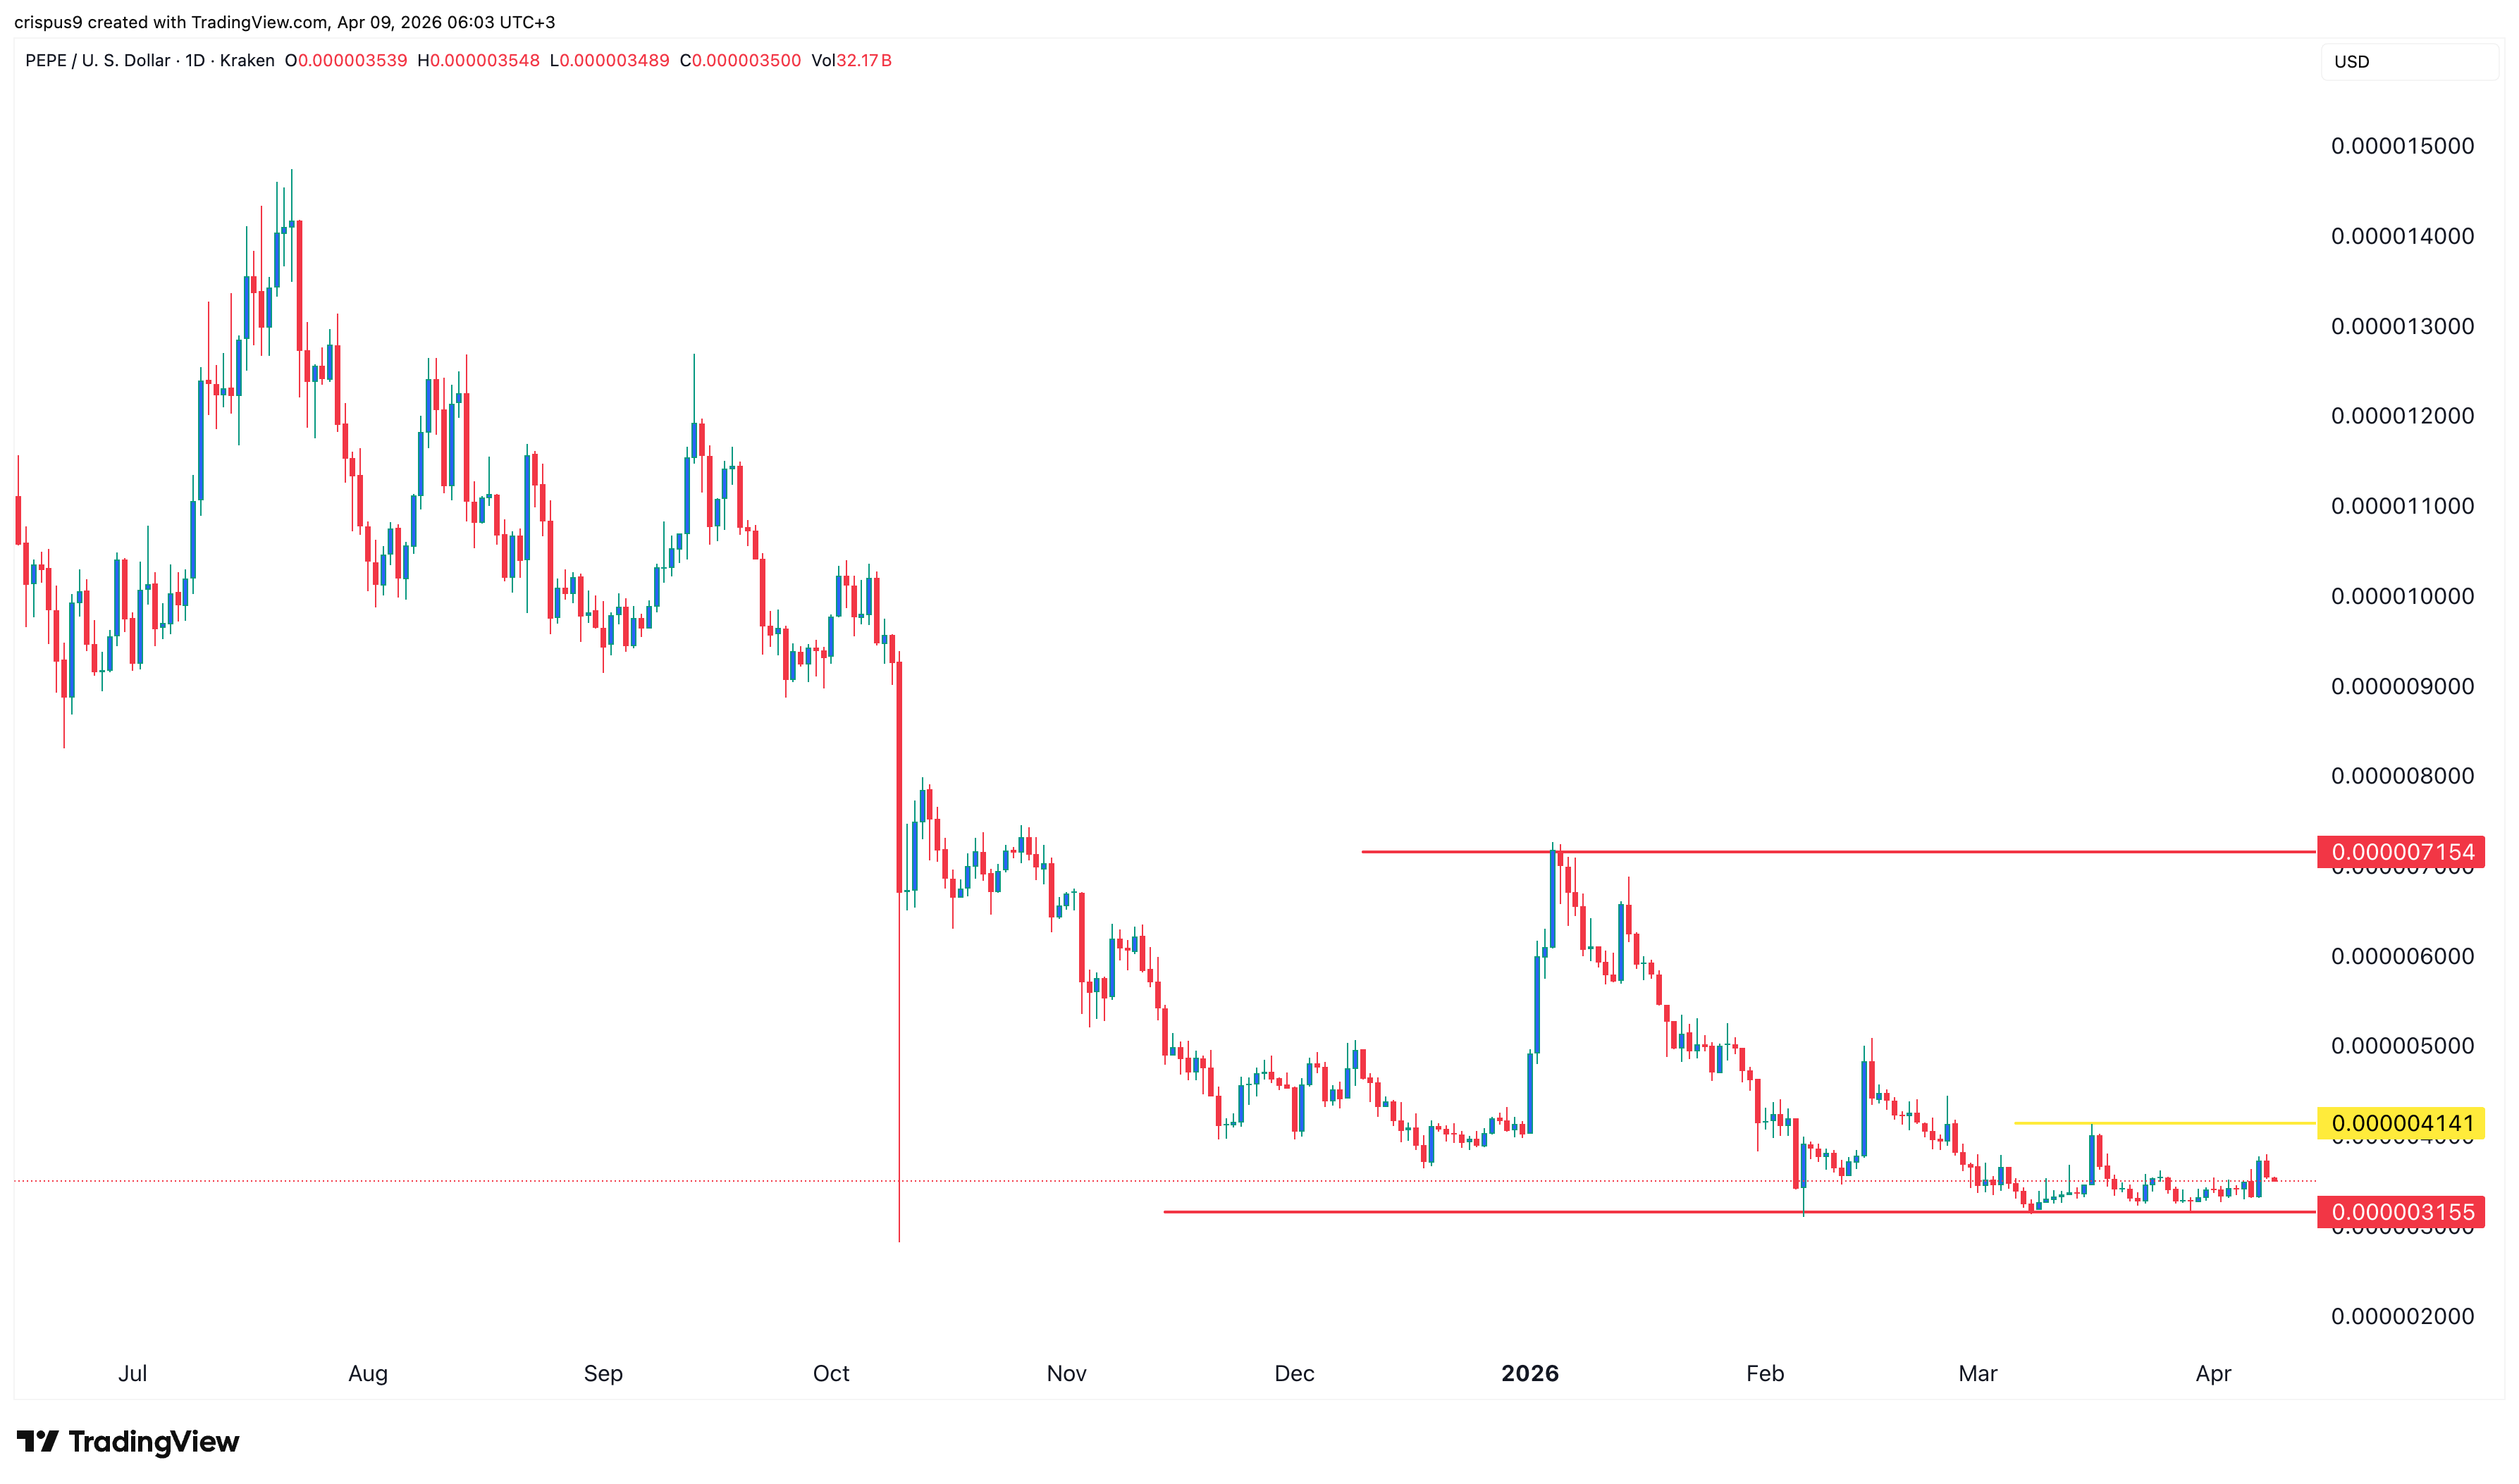
The daily timeframe chart shows that the Pepe price has moved sideways in the past few months. It bottomed at $0.000003155, where it has failed to move below since February this year.
The token has remained below the 50-day and 100-day Exponential Moving Averages (EMA), a sign that bears remain in control. Also, the token has remained below the Supertrend indicator.
On the positive side, the token has formed a giant bottoming pattern, with its neckline at $0.000007155, its highest point on December 4. It is also part of the accumulation section of Wyckoff Theory in technical analysis.
Therefore, the token will likely bounce back in the near term as long as it remains above the key support level at $0.000003155. If this happens, the next key target level to watch will be $0.000004142, which is 20% above the current level. This target is at its highest point on March 16.
On the other hand, a move below that level will point to more downside, potentially to the key support level at $0.0000030.
READ MORE: Nebius Stock Price May Rally to $150 and Above: Here’s Why