


Dogecoin price has gone horizontal over the past two months, as third-party data shows its demand in spot, futures, and Exchange Traded Funds (ETFs) has waned. DOGE was trading at $0.0914, down sharply from its 2021 high of $0.7376.
Dogecoin ETF Inflows Have Waned
American investors are no longer buying Dogecoin ETFs amid the crypto winter. Data compiled by SoSoValue shows that Grayscale’s GDOG, 21Shares’ TDOG, and Bitwise’s BWOW are struggling. The three funds have not had any inflows since March 16, when they added $193k, possibly from one investor.
In total, these funds have brought in $7.64 million in inflows since their inception, with cumulative assets totaling $9.32 million, which accounts for 0.07% of Dogecoin’s market capitalization.
This performance mirrors that of other altcoin ETFs. For example, the recently launched 21Shares Polkadot ETF has seen just $544k in cumulative inflows, with total assets of $10 million. It has experienced just one day of inflows since its launch.
READ MORE: New BlackRock Bitcoin ETF Will Pay a Big Dividend: Will it Be Better Than IBIT?
Similarly, the VanEck and Grayscale Avalanche ETFs have had no inflows since March 18. Their cumulative inflows were $9.76 million, while the total assets were $16.8 million.
More data shows that demand for the Dogecoin token has worsened over the past few months, mirroring the broader crypto market. Its 24-hour volume stands at $1.2 billion, well below its normal levels, when it reached over $10 billion.
The futures open interest has also continued to fall over the past few months. It dropped to $1.1 billion, down from last year’s high of over $6 billion. Falling open interest is a sign that investors are no longer trading DOGE as they did a few months ago.
DOGE price has lacked catalysts over the past few months. Traders have pointed to the potential launch of X Payments by Elon Musk. The argument is that the company may decide to add Dogecoin to the payment suite, which is highly unlikely.
Dogecoin Price Prediction: Technical Analysis
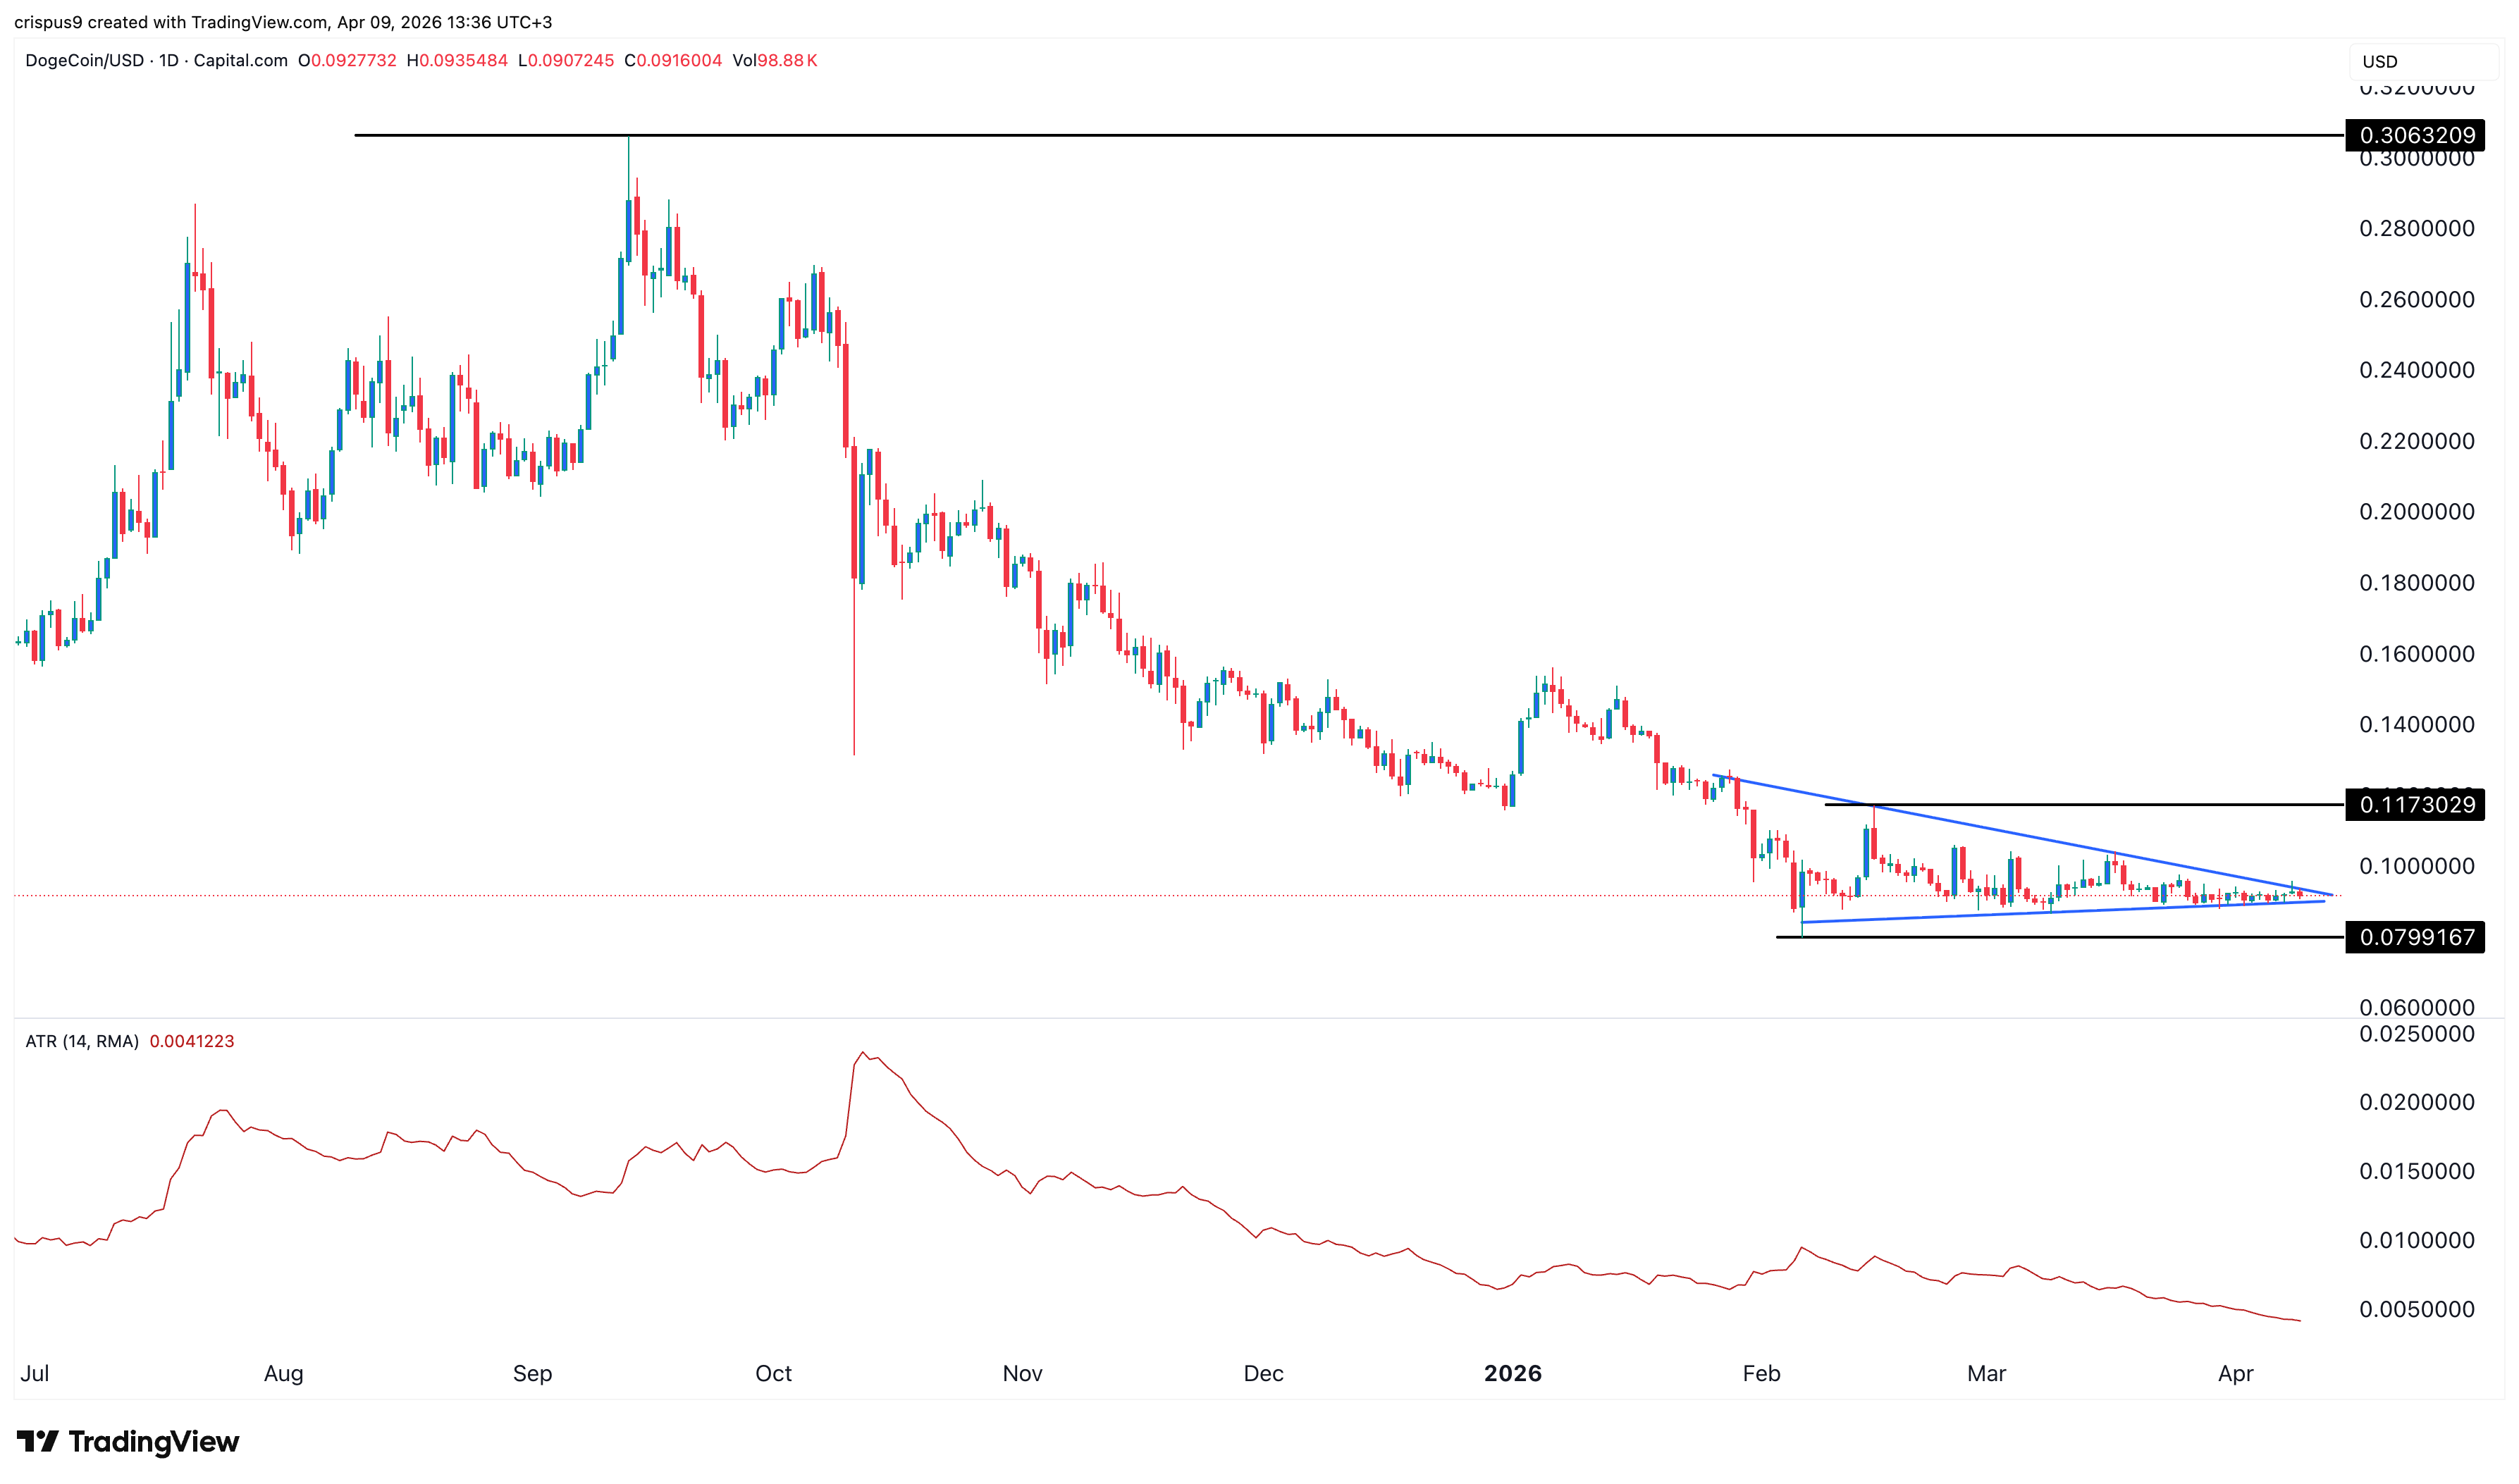
The daily timeframe chart shows that the DOGE price has remained in a tight range in the past few weeks. It was trading at $0.0916, where it has been in this period.
The token has remained below all moving averages, while the Average True Range (ATR) has continued falling. That is a sign that its volatility has waned.
A closer look shows that the token has formed a symmetrical triangle, with its two sides nearing confluence. That is a sign that the token is nearing a big move in the near term.
The big move may go either way. A bearish breakdown could send it to the key support level at $0.08, while a bullish breakout could push it to $0.1172.
READ MORE: Pepe Coin Price Prediction as Canary Files For New Spot PEPE ETF