- Ethereum price has formed an ascending triangle pattern on the daily chart.
- Odds that the Senate will pass the CLARITY Act have dropped sharply.
- The price is also reacting to the geopolitical issues that have pushed oil prices higher.
Ethereum price remained on edge on Wednesday as the recent rally stalled, and the Crypto Fear and Greed Index moved below the fear zone, and the CLARITY Act odds fell. ETH token fell to $2,292, down from this month’s high of $2,460.
Ethereum Price Drops as CLARITY Act Odds Fall
ETH price retreated slightly after a Polymarket poll showed that the odds of the US Senate passing the CLARITY Act faded. The odds of the bill being passed dropped to 47% from the year-to-date high of 82%.
These odds declined after retiring Senator Thom Tillis threatened to kill the bill. He insists that the bill must have provisions that restrict White House officials from promoting tokens.
According to Paul Barron, 7 Democrats have joined Tillis in insisting that ethics rules be added, citing the Trump family, which holds millions of dollars in coins.
At the same time, the gridlock around stablecoin yields has persisted. Banks want crypto exchanges like Coinbase and Kraken barred from offering stablecoin yield on their platforms. Crypto companies insist that the yields are necessary and won’t have a negative impact on banks.
READ MORE: Is the MSTR Stock at Risk as Bitcoin and Fear and Greed Index Slip?
While some large banks have recently embraced cryptocurrencies, many have been fighting the industry for years. In addition to the stablecoin issue, banks have also opposed the granting of bank charters to crypto companies.
Ethereum price also declined as the Crypto Fear and Greed Index retreated. It moved from the greed zone of 62 to the current 40 and is at risk of moving back to the fear zone. Ethereum tends to come under pressure when the index is falling.
The decline is also due to ongoing geopolitical issues that have pushed crude oil prices higher, with Brent and West Texas Intermediate (WTI) rising to $112 and $100, respectively. This surge will likely lead to higher inflation, prompting the Federal Reserve to maintain a hawkish stance.
ETH Price Prediction: Technical Analysis
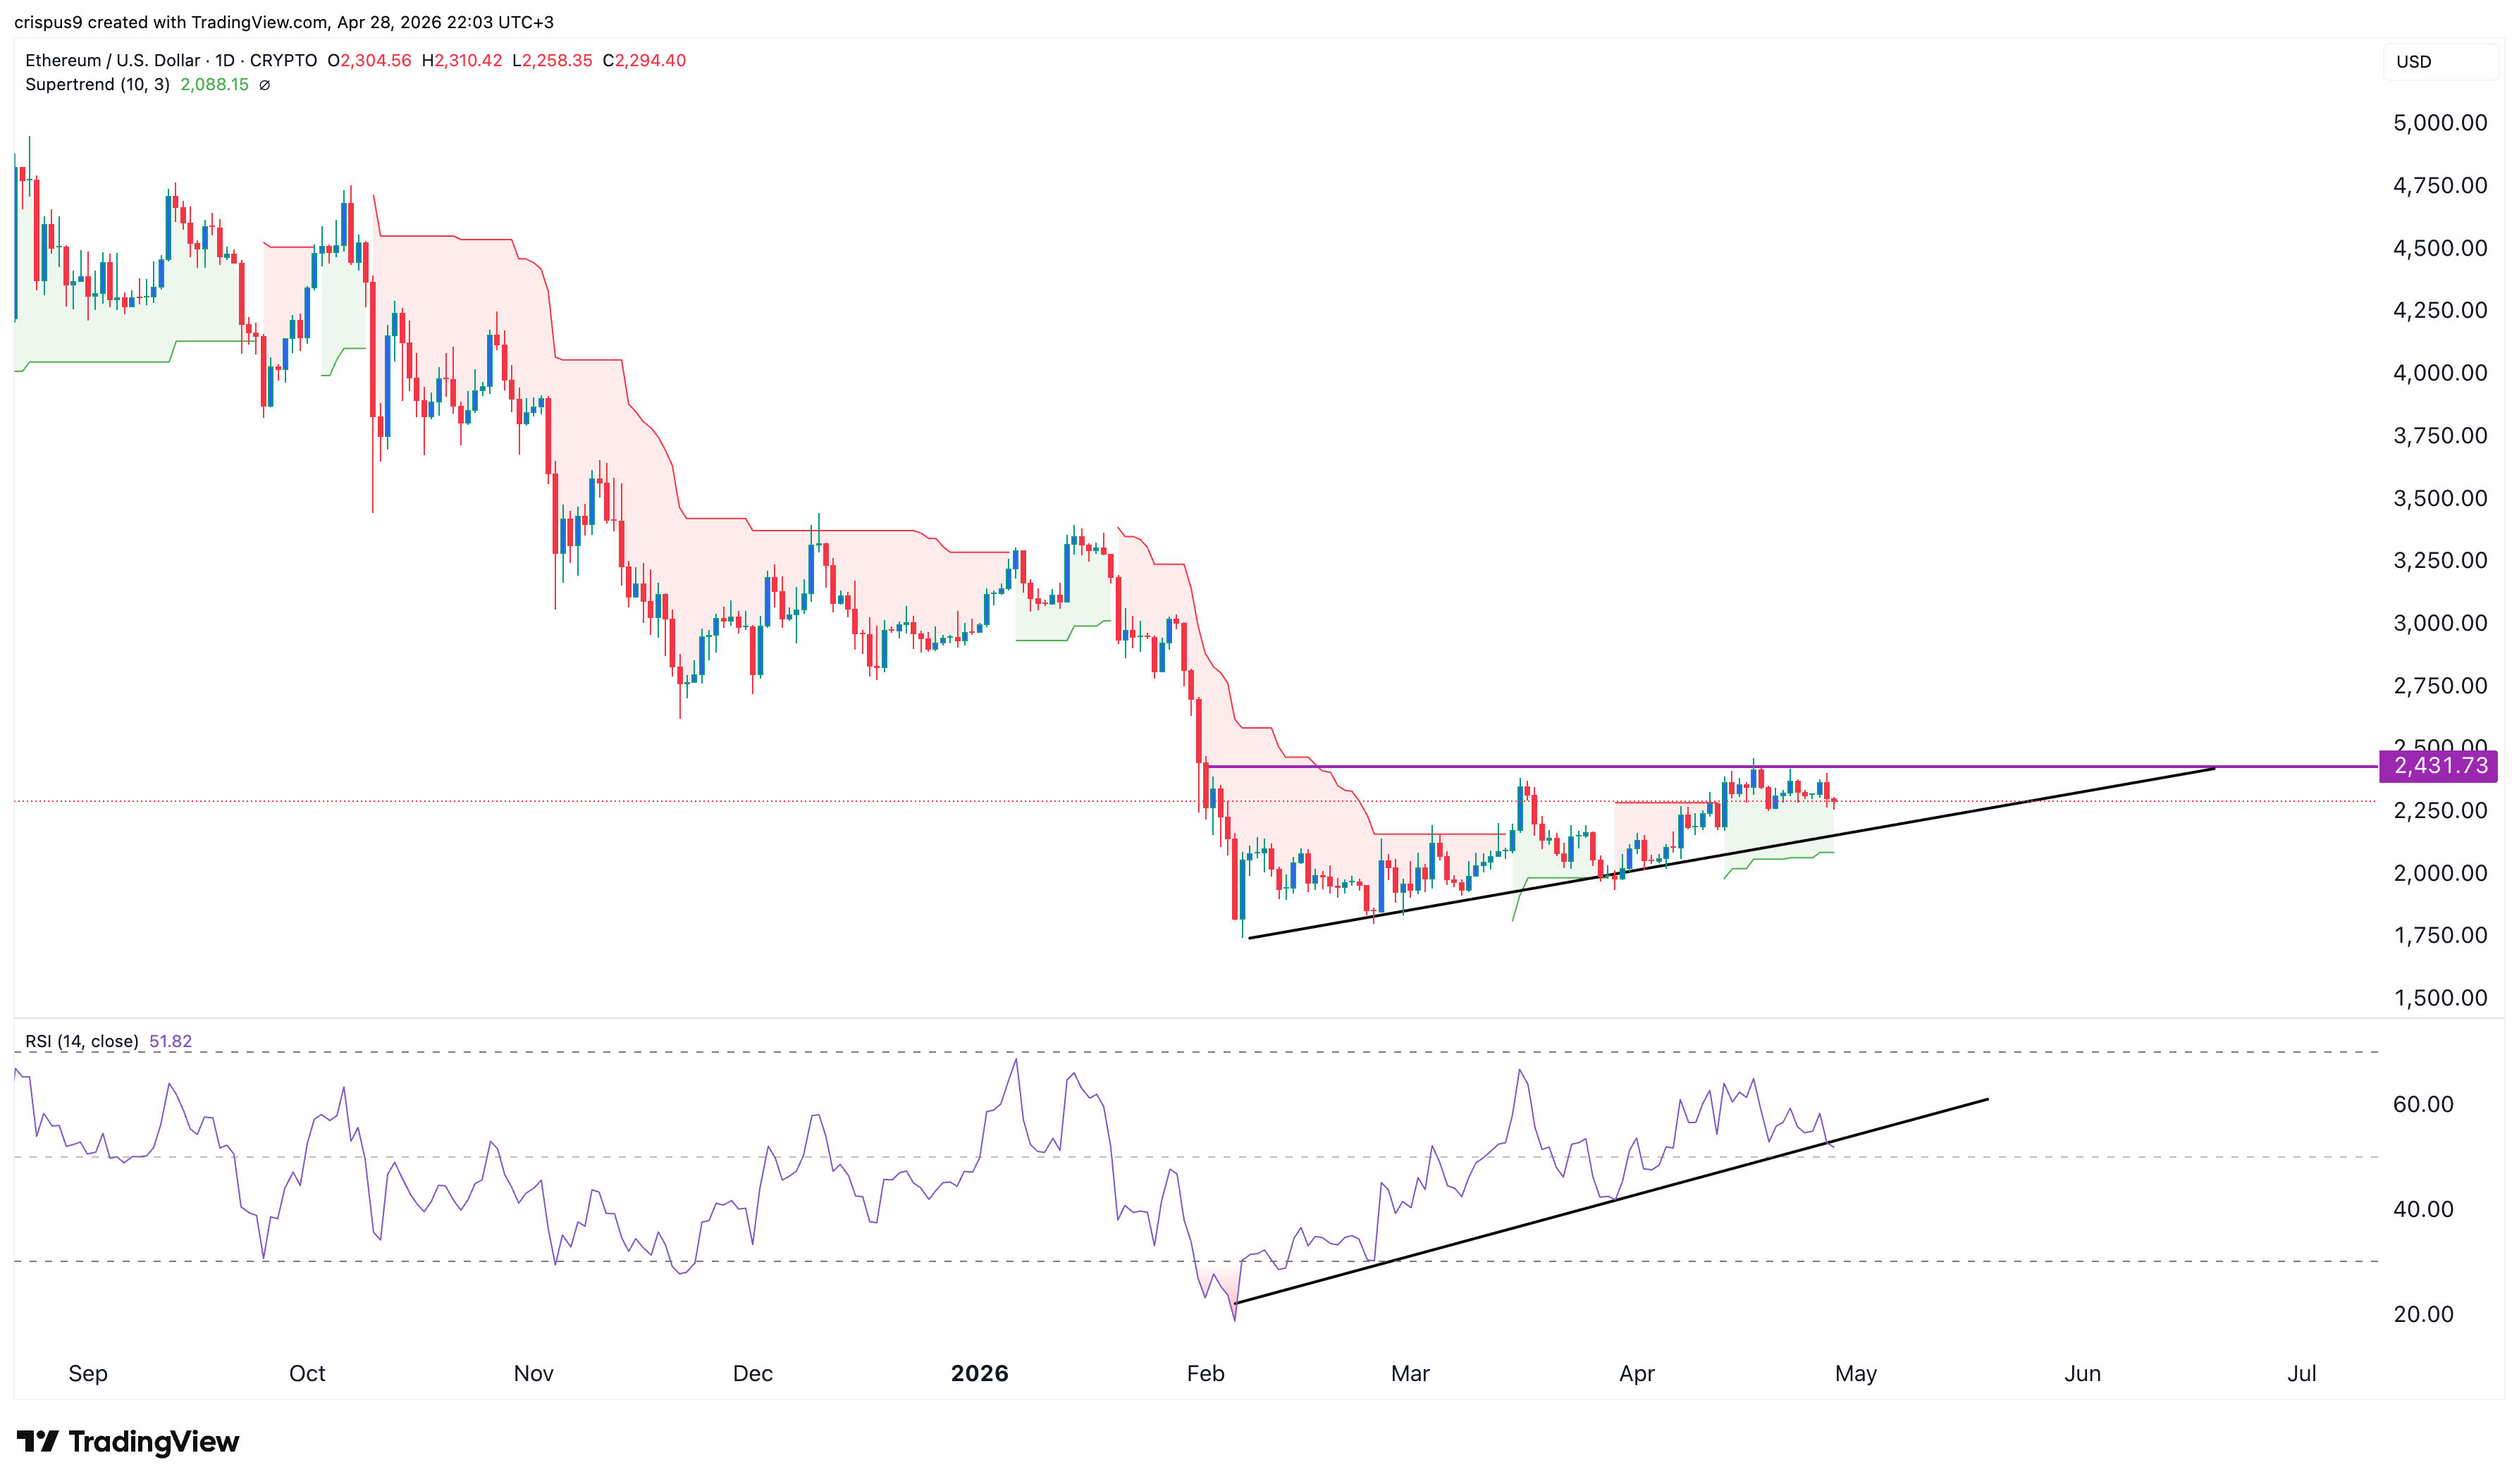
The daily timeframe chart shows that ETH has remained in a narrow range over the past few weeks.
On the positive side, it has formed an ascending triangle pattern, characterized by horizontal resistance and an ascending trendline. This triangle is one of the most common bullish continuation signs in technical analysis.
The token has moved above the Supertrend indicator, a sign that bulls remain in control for now. It has also moved above the 50-day Exponential Moving Average (EMA), while the Relative Strength Index (RSI) has formed a series of higher highs.
Therefore, the Ethereum price will likely have a strong bullish breakout, potentially to the key resistance level at $3,000. This view will be confirmed if the token moves above the triangle’s upper boundary at $2,430.
READ MORE: Here’s Why Trump Media Stock May Crash to $5 and Below Soon