


- XRP price has remained inside a narrow range in the past few weeks.
- Spot XRP ETFs had the best month of the year in terms of inflows.
- The possibility that the CLARITY Act will become law has soared this month.
XRP price has remained inside a narrow range in the past few weeks despite the soaring Ripple ETF inflows and the rising odds that the CLARITY Act will be passed. Ripple token was trading at $1.3880, inside the range it has been in since February this year.
XRP ETF Inflows Have Soared
Ripple price has remained inside a narrow range in the past few months despite the rising ETF inflows. Data shows that the spot XRP ETFs added over $81 million in April this year, the best performance this year. It was a major reversal after the funds shed over $30 million in March.
Data shows that the Bitwise’s XRP ETF has gained over $315 million in assets, while Canary’s XRPC have over $277 million. Franklin Templeton’s XRPZ and 21Shares’ TOXR have accumulated over $251 million and $150 million, respectively.
XRP price has also remained as the possibility that the CLARITY Act will become law soared. Data shows that there is a 62% probability that the bill will become law later this year s a 63% chance that the actt will become law this year. These odds rose after Coinbase’s CEO urged the Senate to mark it up.
In theory, XRP will be one of the top beneficiaries of the bill because of the role that Ripple Labs plays in the stablecoin industry, where the RLUSD has accumulated over $1.4 billion in assets.
READ MORE: PayPal Stock in Focus as New CEO Reshapes Venmo Ahead of Earnings
The ongoing XRP price consolidation is likely because investors are questioning the relationship between Ripple Labs and the XRP token. While Ripple has made some major announcements this year, investors are concerned that its impact on the XRP token is limited.
For example, it is unclear how the recently acquired licenses in countries like the United Kingdom and Luxembourg will impact the XRP token itself. Indeed, data shows the key XRP Ledger metrics like network fees, active addresses, and burn rate have crashed in the past few months.
XRP Price Prediction: Technical Analysis
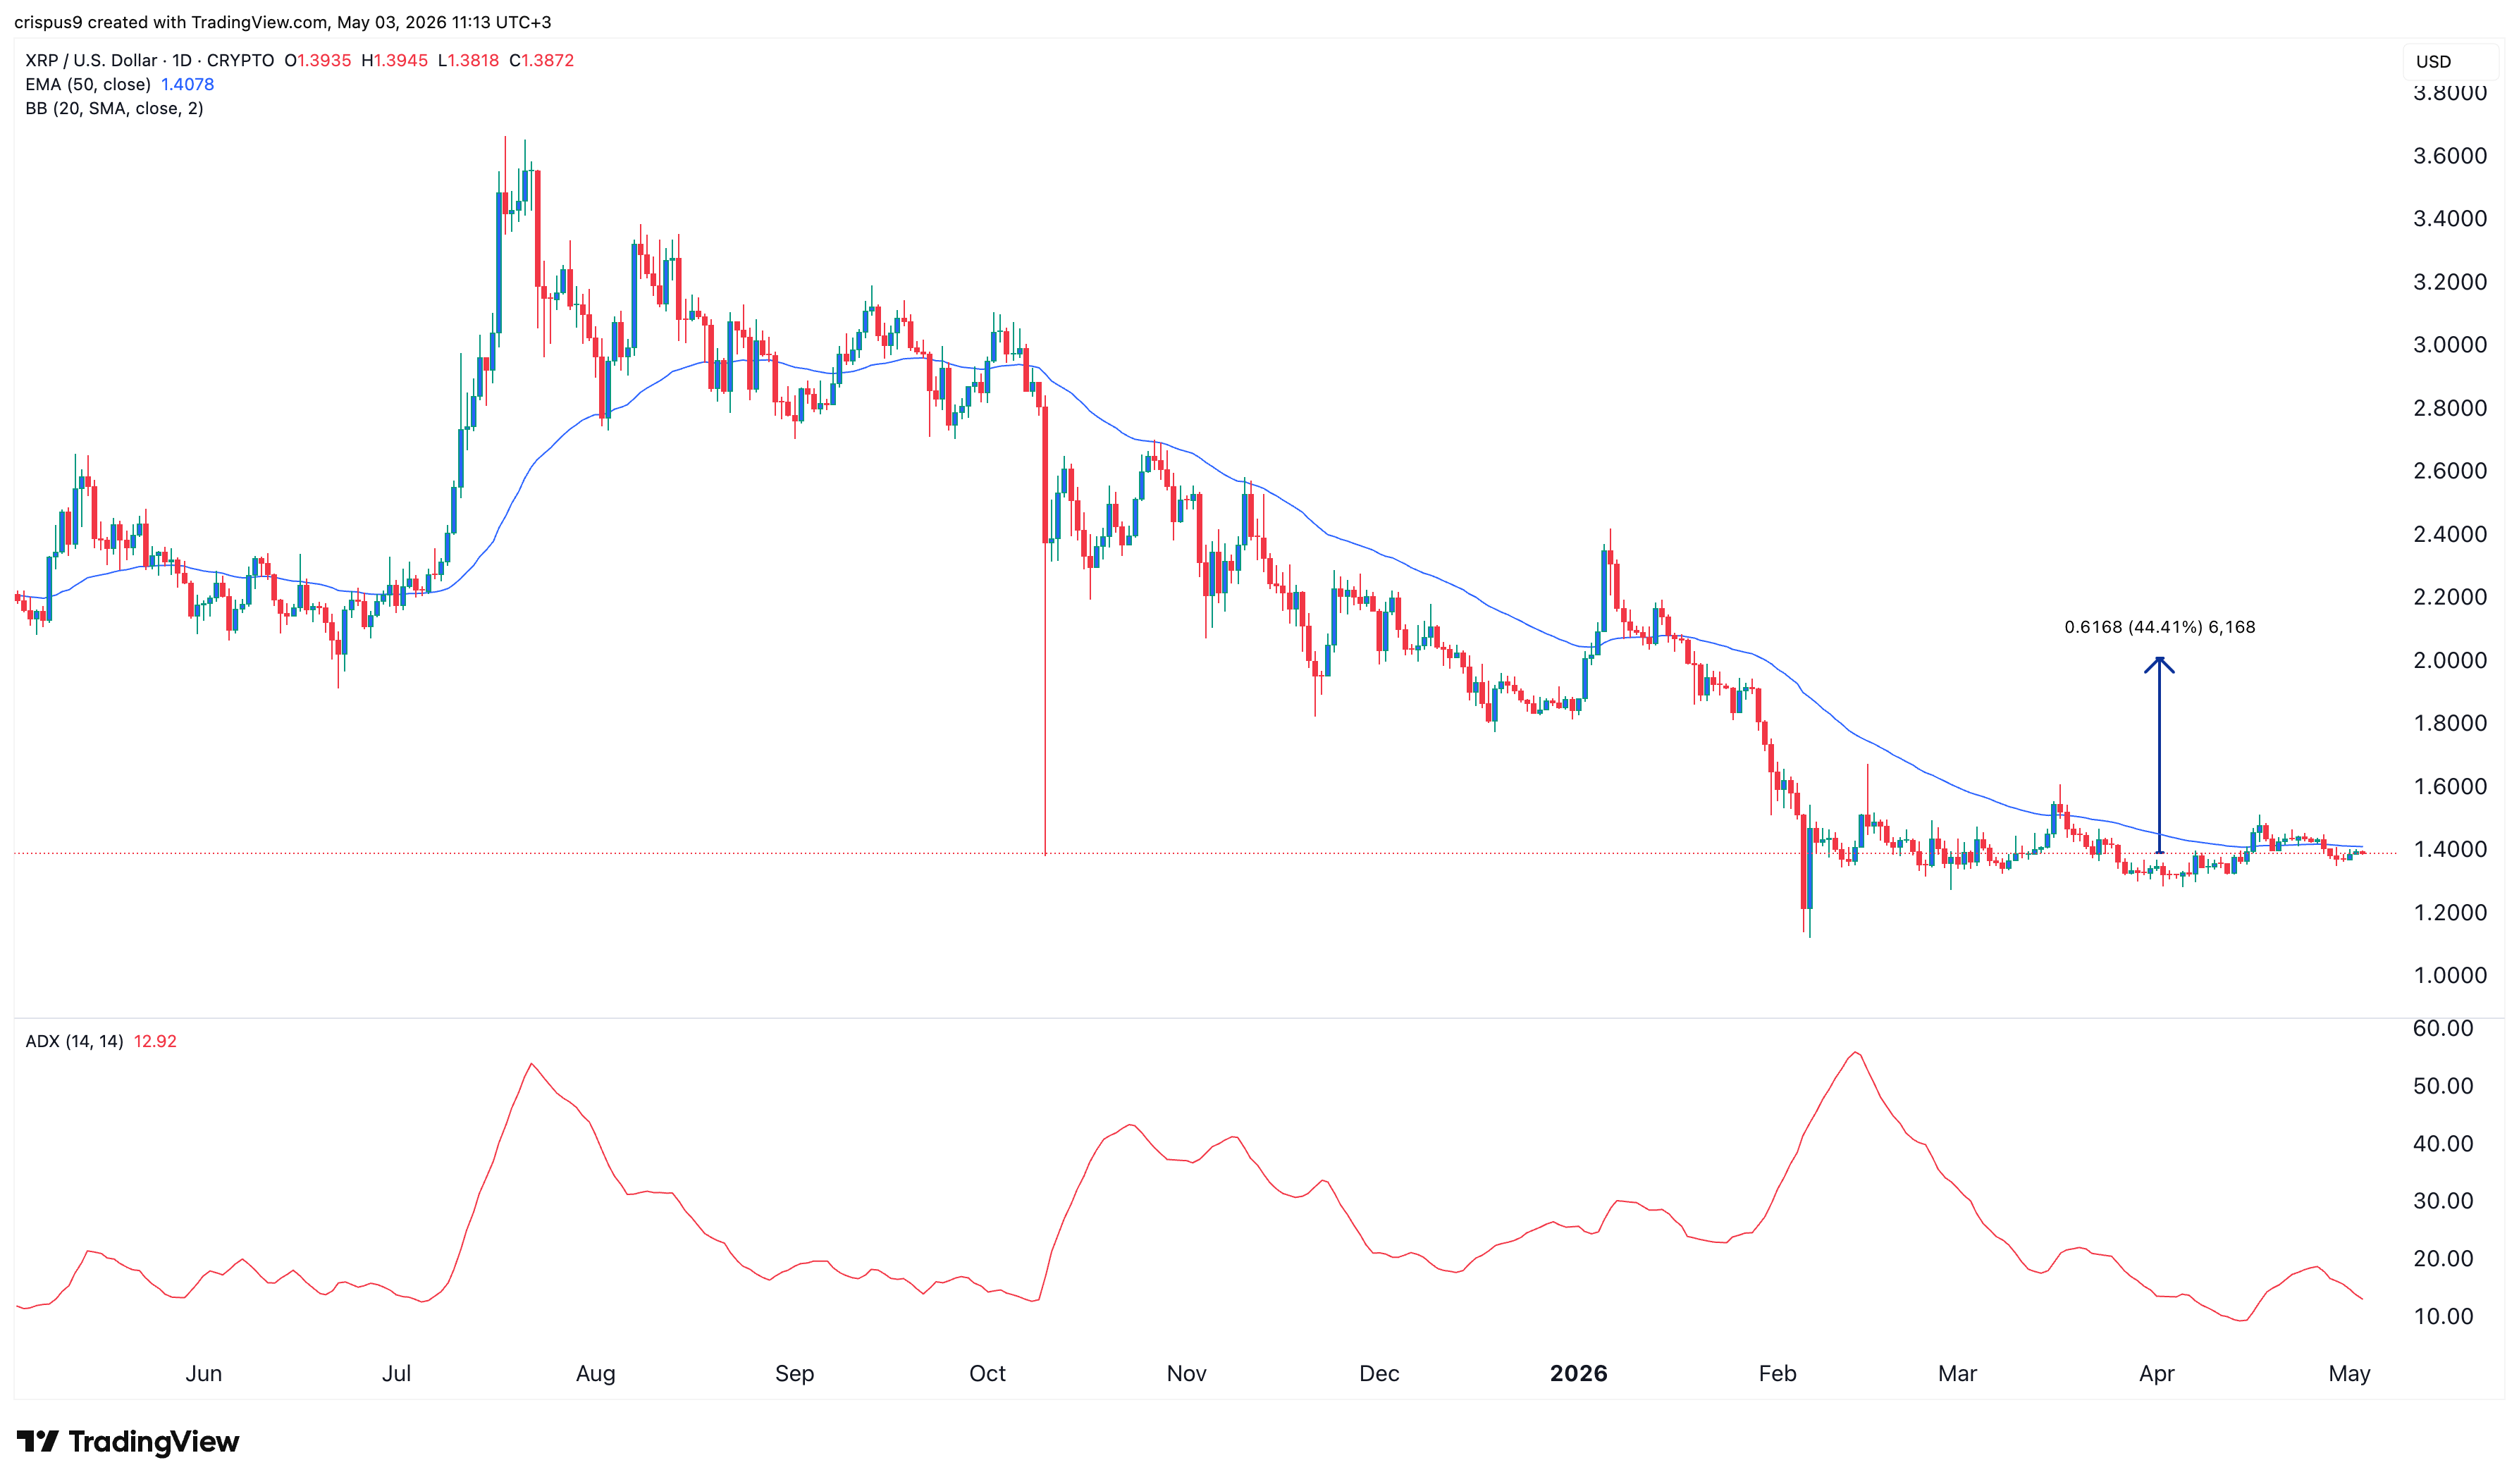
Ripple price chart | Source: TradingView
The daily timeframe chart shows that the XRP token has remained inside a narrow range in the past few weeks.
This price action explains why the token is trading at the 50-day and 100-day Exponential Moving Averages (EMA) and why the Average True Range (ATR) has slumped to the lowest level in weeks.
The token has formed a double-bottom pattern, which is a common bullish reversal sign in technical analysis. Also, the spread between the three lines of the Bollinger Bands have narrowed and there are signs that it is in the accumulation phase of the Wyckoff Theory.
Therefore, the token will likely have a strong bullish breakout in the near term. If this happens, the next key target to watch will be the psychological level of $2.0, which is 45% above the current level.
READ MORE: PayPal Stock in Focus as New CEO Reshapes Venmo Ahead of Earnings