


- ETH compresses toward triangle apex; $2,410 remains the breakout confirmation level.
- Ethereum spot ETFs logged $189.46M in weekly outflows through May 14, 2026.
- Exchange supply rose from 4.2% to 4.6% in 10 days, fastest pace in recent memory.
- TD Sequential weekly sell signal targets $1,900 short-term if triangle support fails.
Ethereum price is down on the day at $2,255, pressed into the narrowing apex of a symmetrical triangle that has been compressing since February’s $1,800 low. The structure is now in its final 20%, and a resolution looks close. What makes this juncture particularly loaded isn’t the pattern alone; it’s the macro and flow data stacking up alongside it.
Ethereum Price Holds Triangle Support at $2,250 as Apex Nears
The converging trendlines on the daily ETH/USDT chart define the immediate battlefield. Rising support runs along $2,250, while overhead resistance is capped by a horizontal level at $2,400, a ceiling that has rejected every meaningful rally attempt since early April.
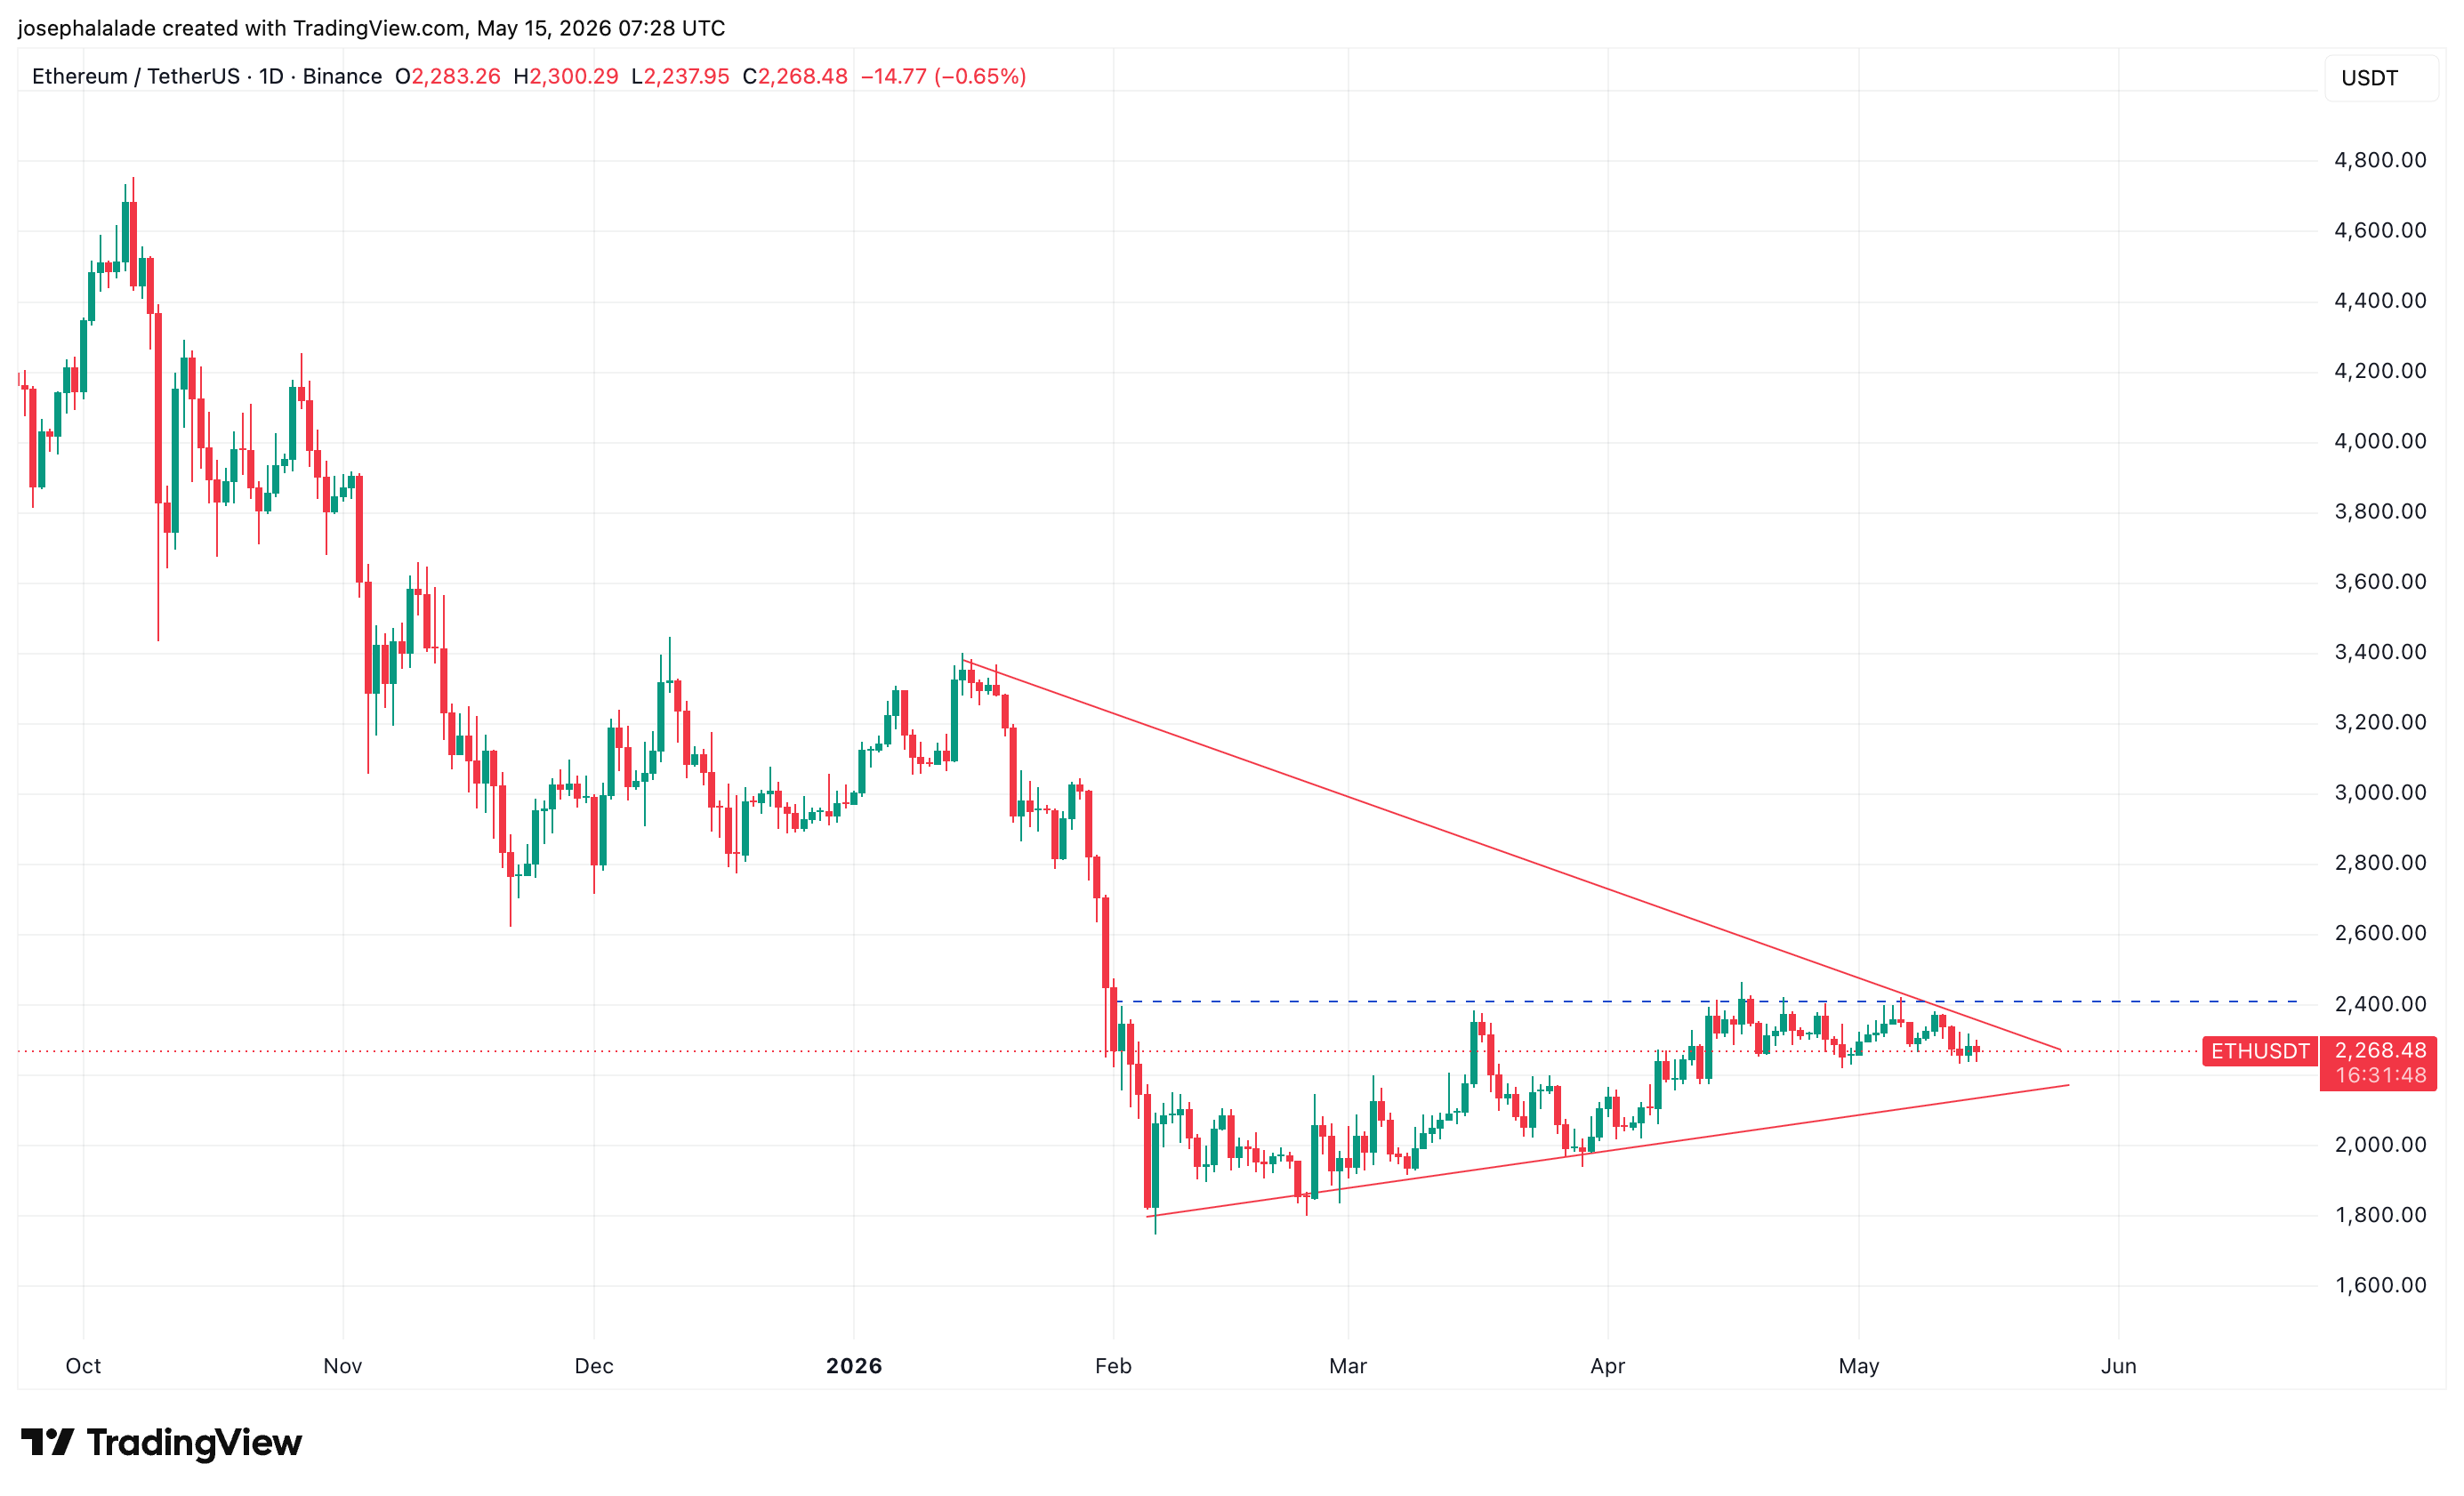
A daily candle closing above it would signal a genuine shift in market structure. Without that, any push into the upper trendline stays a test rather than a breakout.
Analyst Ali Charts flagged a fresh TD Sequential sell signal on the weekly timeframe last week, the same setup that preceded an 87% rally from April 2025, a 134% surge in June, and a 63% correction from the August 2025 top. His three downside targets: $1,900 short-term, $1,565 mid-term, and $1,090 long-term if selling pressure accelerates.
The Ethereum price prediction splits cleanly along the triangle lines. A breakout above $2,410 targets $2,800 and then $3,000. However, a breakdown below $2,250 targets $2,000 as the immediate floor, consistent with the corrective sequence Ali Charts is mapping.
ETH ETF Outflows and Rising Exchange Supply Add Selling Pressure
Four consecutive days of net outflows from Ethereum spot ETFs, totaling $189.46 million for the week ending May 14, follow a single positive week of just $70.49M. The contrast with April 17’s $275.83M weekly inflow is sharp.
Total net assets have declined to $13.45B from the $30.58B all-time high recorded in August 2025, and the weekly trend has been negative in two of the last three windows. Institutional appetite, at least through the ETF channel, has pulled back.
And still, Ethereum crypto’s exchange supply has climbed to 4.6%, up from 4.2% in just ten days, the fastest near-term accumulation on exchanges since levels were much higher.
Santiment recorded $74.58M in network realized profits on May 14, the highest reading in three weeks, even as the ETH price dropped roughly 5.5% across those same three days. Wallets that accumulated below $2,000 during February and March are profitable at current levels and selling into that margin while it exists. Volume compressed near $2,241 on the 4-hour chart, consistent with distribution rather than accumulation.
READ MORE: Bitwise Launches Hyperliquid ETF BHYP With In-House Staking