


- XRP price remains in a narrow range despite the recent crypto rally.
- The coin may benefit from the ongoing XRP ETF inflows.
- Brad Garlinghouse explained what makes the XRP token unique.
XRP price has continued to underperform the broader crypto industry this month. Ripple was trading at $1.4673 on Friday, within the range it has traded in over the past few months. In contrast, Bitcoin (BTC) has jumped from $60,000 to $82,000 today.
XRP Price Underperforms Despite ETF Inflows and CLARITY Act
The Ripple price has remained in a narrow range this week despite having some notable catalysts. One of these is the fact that American investors are accumulating the token.
Data shows that spot XRP ETFs are having their best month this year. These funds added over $18.52 million in assets on Thursday, bringing the monthly gains to over $83 million. This is much higher than the $81 million that they added last month. The cumulative inflows now stand at over $1.37 billion, with the net assets being $1.25 billion.
In most cases, ETF inflows in an asset whose price is moving sideways are usually a sign of accumulation. It normally signals that institutional investors are buying, as they expect a breakout to occur over time.
READ MORE: Venice Token Price: Here’s Why this AI Coin is Crashing Today
XRP price also continues to waver after the Senate Banking Committee voted to advance the CLARITY Act. This means that the Market Structures Bill will now move to the Senate, where it will attract bipartisan support. XRP is exposed to the bill through Ripple USD (RLUSD), its native stablecoin with over $1.5 billion in assets. Analysts predict that the bill will lead to more adoption of stablecoins as crypto exchanges will be able to offer rewards.
Meanwhile, Brad Garlinghouse created a video to explain what makes XRP unique. In it, he noted that it was created by core Bitcoin contributors who saw an opportunity to build something that solves a payments problem.
He also noted that XRP had now processed over 4 billion transactions, with most taking between 3 and 5 seconds and costing less than a penny.
Still, the main challenge is that XRP Ledger’s network activity has dried up in the past few months. For example, the number of payments has dropped to 1.3 million a day from a peak of 1.85 million in February. Its burn rate has also plunged over time.
Ripple Price Prediction: Technical Analysis
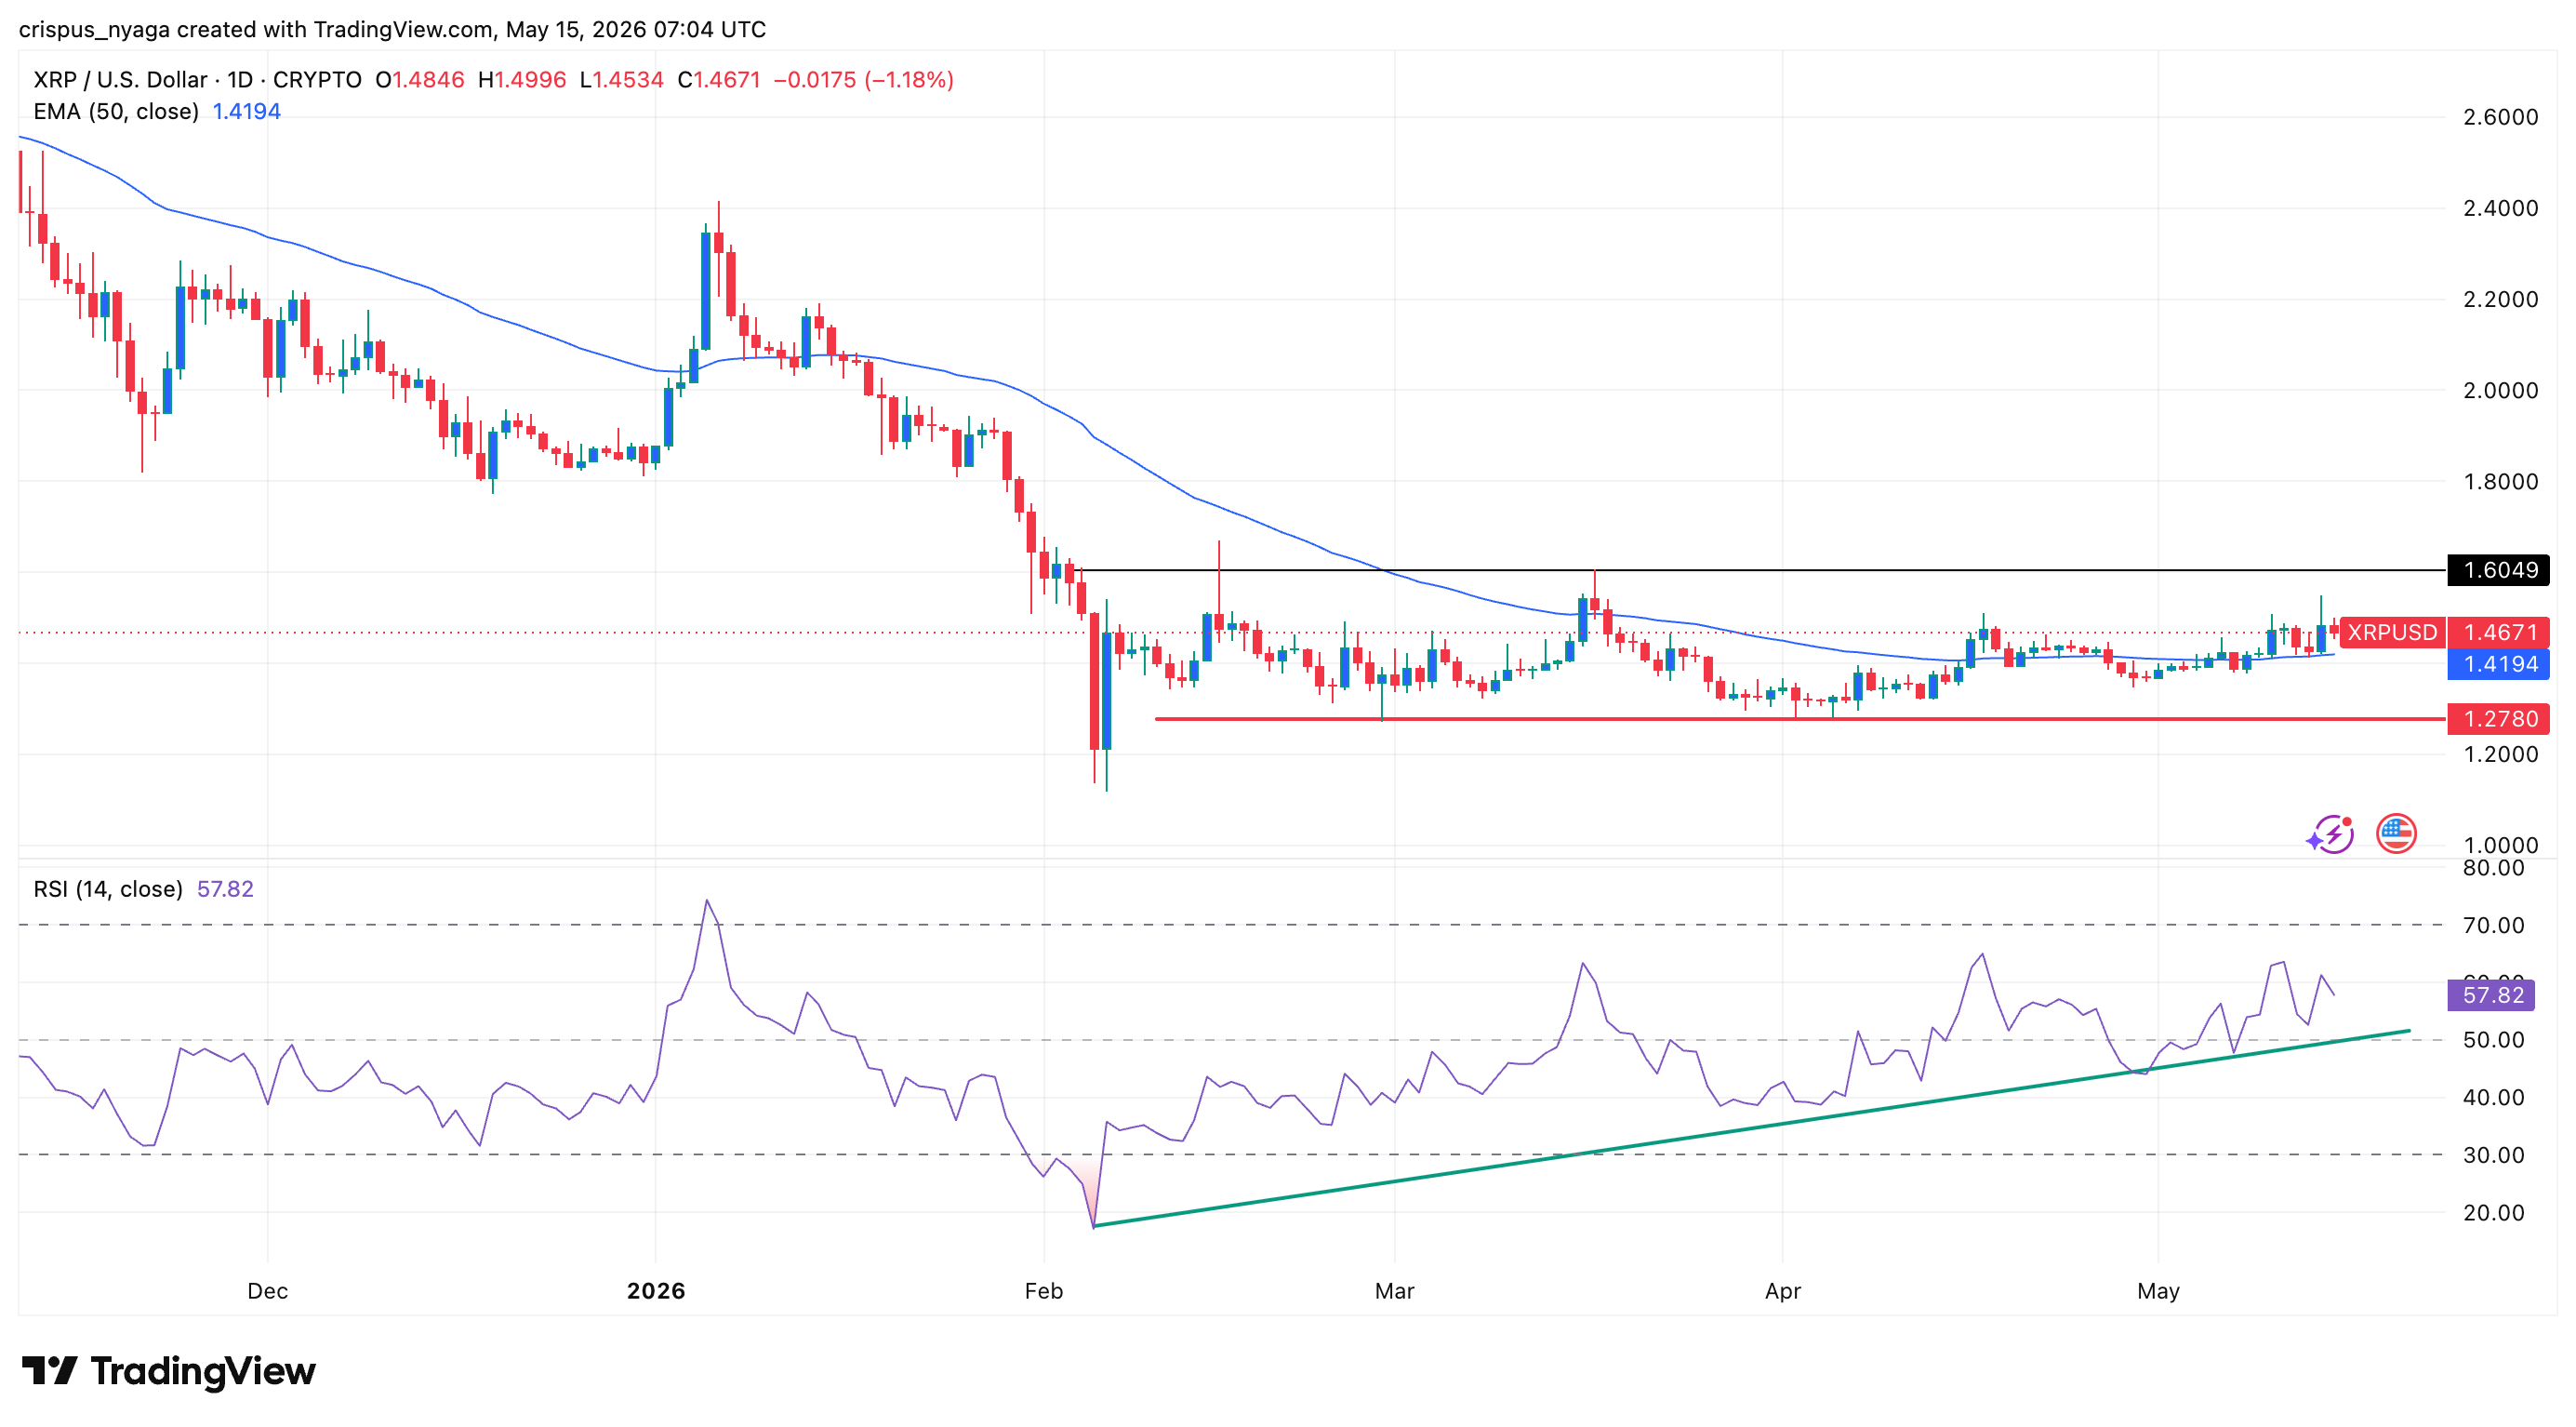
The daily chart shows that the Ripple price has been trading sideways since February this year. It has remained inside the narrow range between the support and resistance at $1.2780 and $1.6050.
On the positive side, the coin has formed a double-bottom pattern at $1.2780, its lowest level in February and April. Its neckline is at $1.6050.
The coin has moved above the 50-day Exponential Moving Average (EMA), a sign that bulls are prevailing. Also, the Relative Strength Index (RSI) has formed a bullish divergence pattern.
Therefore, the token will continue rising as bulls target the key resistance level at $1.6050. A move above that level will suggest more gains, potentially to the psychological level at $2.
READ MORE: Cheap NVIDIA Stock Alert: Rare Chart Pattern Points to a $6.30 Trillion Market Cap Breakout