- Bitcoin price remains under pressure even as the US stock market surges.
- There are signs that smart money investors are selling, as evidenced by the rising ETF outflows.
- The rising wedge pattern suggests that the coin will continue falling.
Bitcoin price slipped to $77,200, down from this month’s high of $82,847, as demand continued to drop. This retreat may accelerate in the coming days as third-party data shows that smart money investors have started to sell their holdings.
Smart Money Investors are Selling Bitcoin
Bitcoin price remained under pressure this week, and this trend may continue in the coming days. For one, data shows that spot Bitcoin ETFs have suffered the longest drought in months. They have shed assets in the last five consecutive days.
These funds have now shed over $1.4 billion in assets, bringing the monthly outflows to $898 million. Earlier this month, these funds added over $1.6 billion in the first six days, and there was hope that they would pass the April milestone when they added $1.9 billion in inflows.
READ MORE: Nio Stock Crashed After Earnings: Here’s Why it May Soar 70% Soon
Bitcoin ETFs have now added $57 billion in inflows since their inception in 2024, with BlackRock’s IBIT having over $62 billion in assets today. It is followed by funds by companies like Fidelity, Grayscale, and Bitwise.
While not an accurate figure, these numbers mean that smart money investors may be selling their Bitcoin holdings. For one, many holders of Bitcoin ETFs are American institutions like Citadel, Goldman Sachs, Millenium Management, and Jane Street.
One possible reason why investors are selling their Bitcoin holdings is to move to the stock market, where top American indices are soaring to a record high. The S&P 500 Index is now trading at an all-time high, while inflows are rising. VOO ETF has added over $58 billion in inflows this year.
The SPDR Portfolio S&P 500 ETF (SPYM) has added $34 billion in assets this year. Other top equity ETFs like SCHD and the Vanguard Total Stock Market Fund, which have added $8.7 billion and $23 billion in inflows.
BTC Price Prediction: Technical Analysis
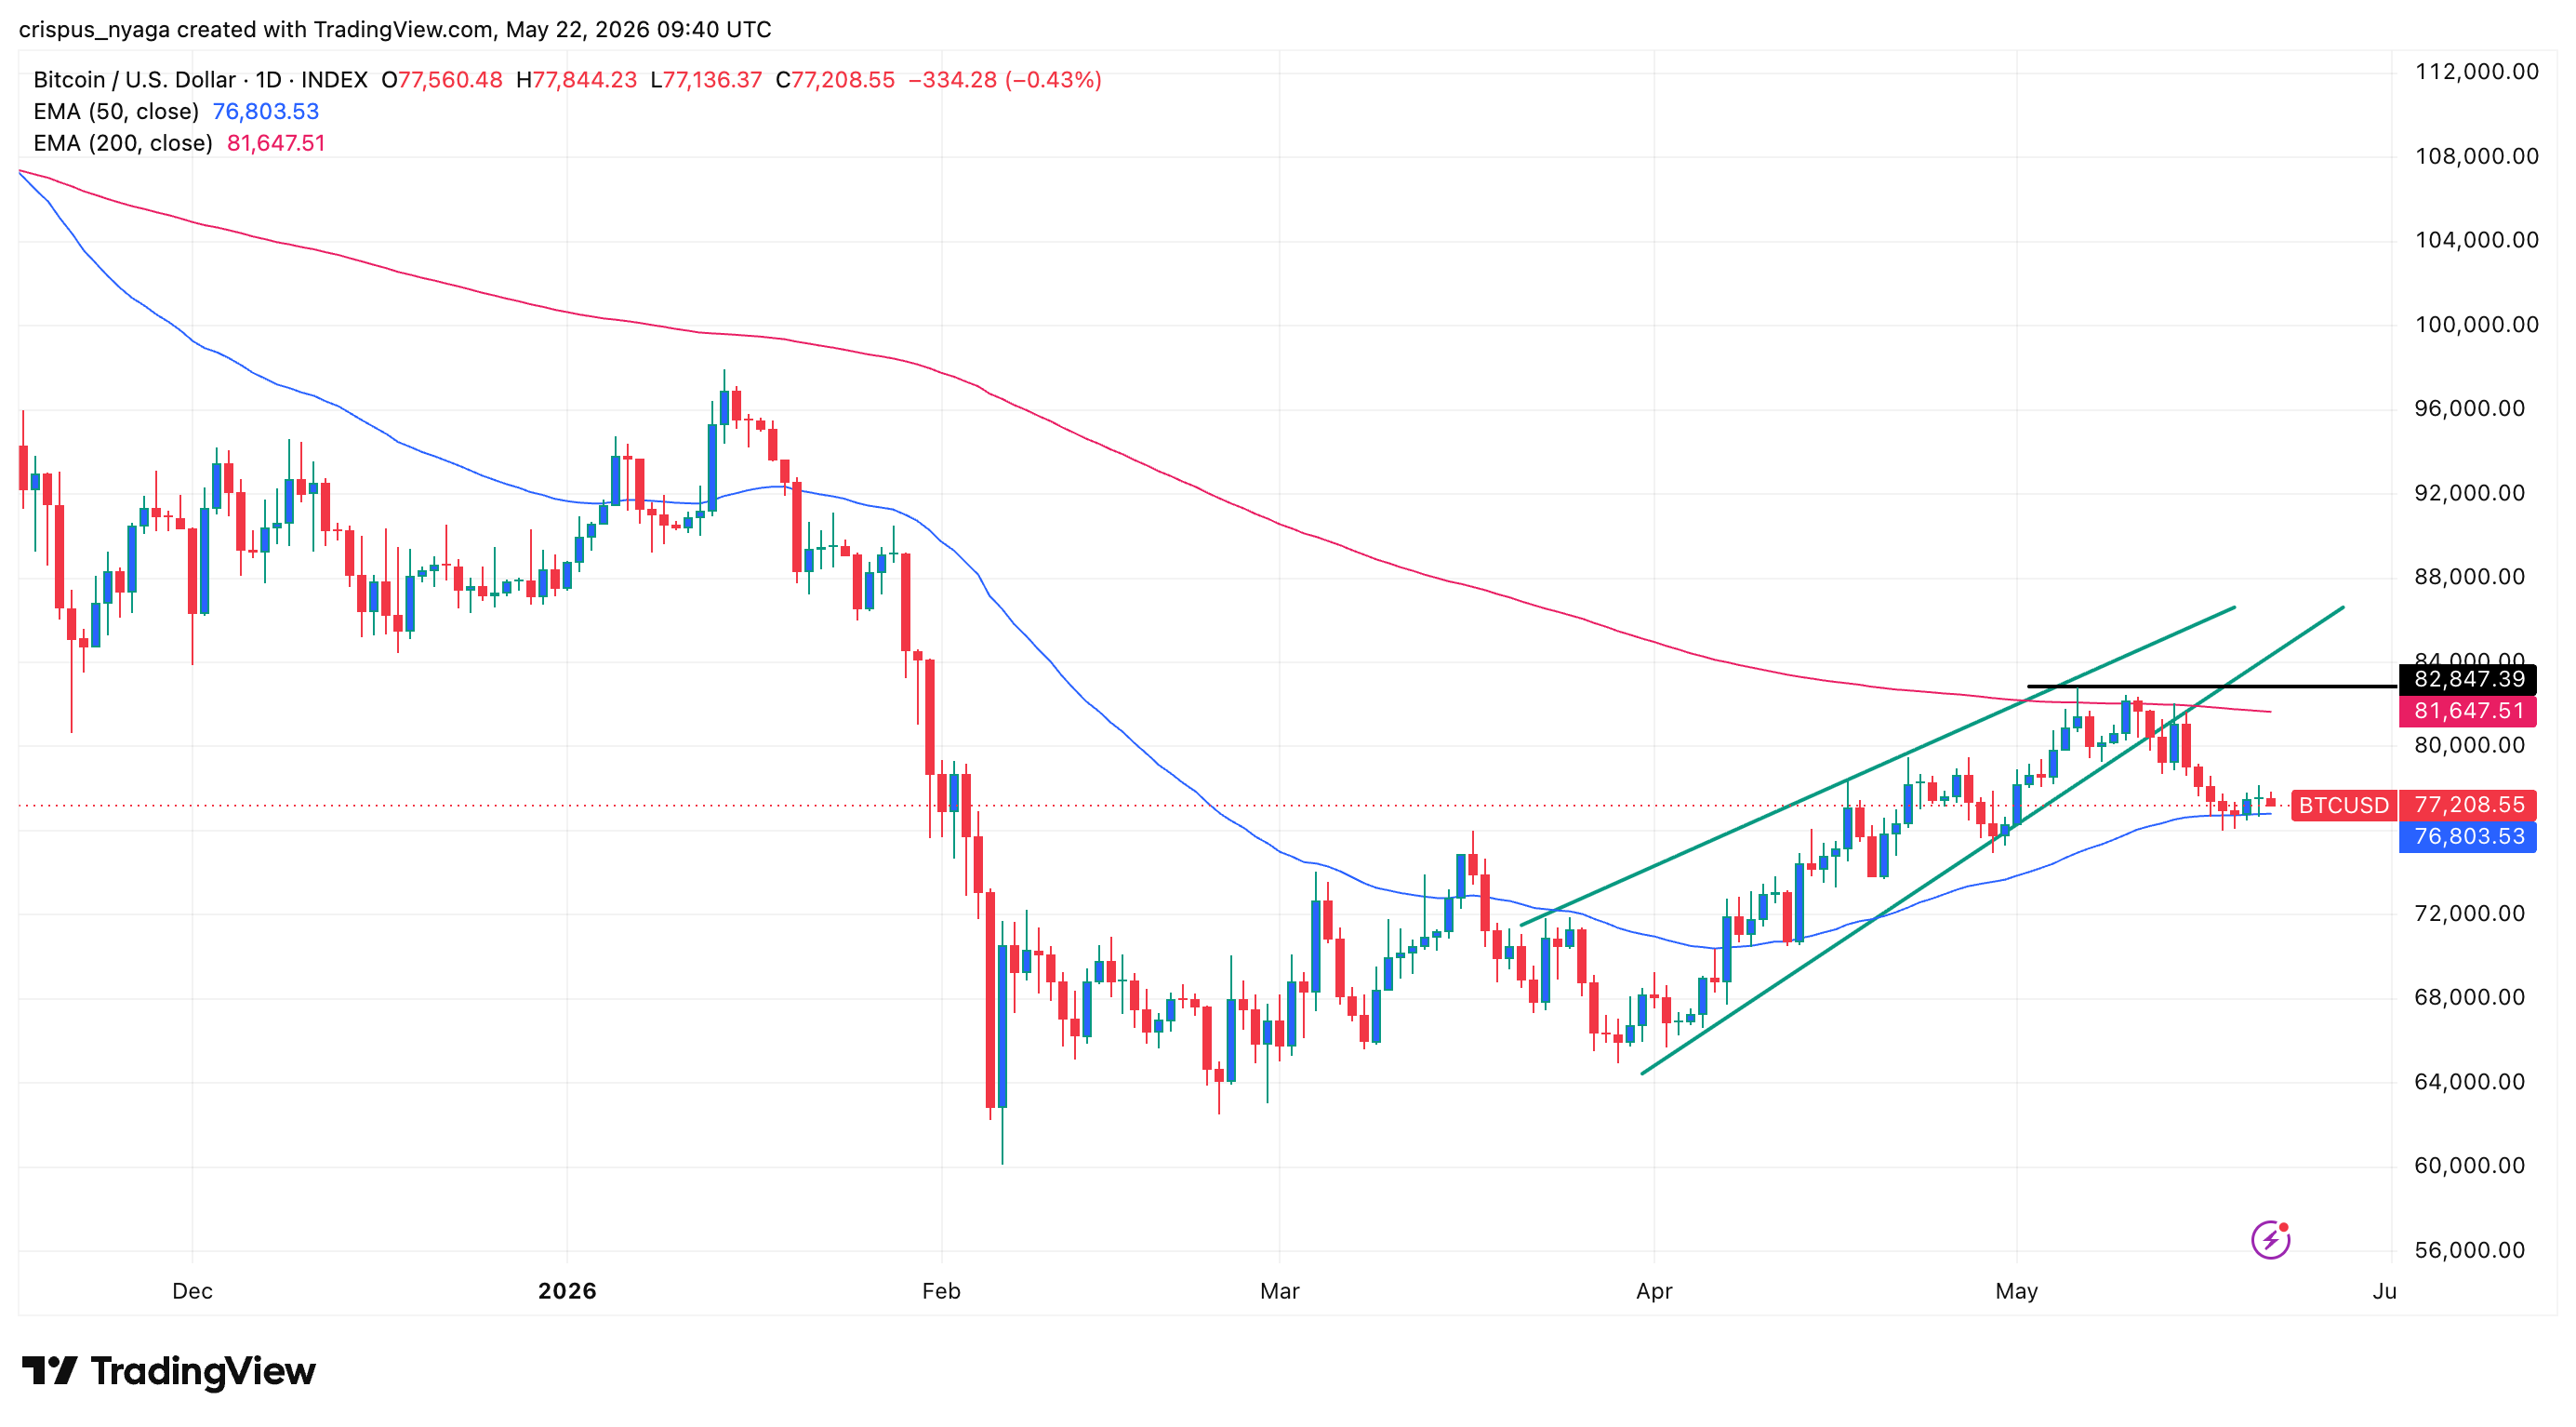
The daily chart shows that the Bitcoin price has crashed from a high of $82,847 in May to the current $77,500. On the positive side, there are signs that it has found substantial support at the 50-day Exponential Moving Average (EMA). That could be a sign that bears are afraid of placing bearish trades below that price.
However, Bitcoin has formed a rising wedge, which is made up of two ascending and converging trendlines. It made a strong bearish breakout below its lower side recently.
Therefore, there is a risk that the coin will continue falling, potentially to the key support level at $70,000. On the flip side, a move above the psychological level ayt $80,000 will invalidate the bearish outlook.
READ MORE: Venice AI Token Price Just Flashed a Risky Pattern: Is it About to Crash?