


Ethereum investors are currently facing a common dilemma. With the price down 35% from its recent high of $4,062, the question is, “Can ETH kickstart a bullish reversal, or will the coin bottom at $1,600?”
The current price of Ethereum (ETH) is $2,657. It has risen 0.41% in the past 24 hours but is down 16% in the last 7 days. The Ethereum chart reveals an interesting story: Both bulls and bears will have a rough ride.
Ethereum Daily Chart
During the daily timeframe, the Ethereum chart formed an inverted head-and-shoulder pattern.
An inverted head-and-shoulders pattern is a technical analysis pattern that predicts a potential trend reversal in a downtrend. It is formed when an asset’s price creates a low (the “left shoulder”), followed by a lower low (the “head”), and then a higher low (the “right shoulder”).
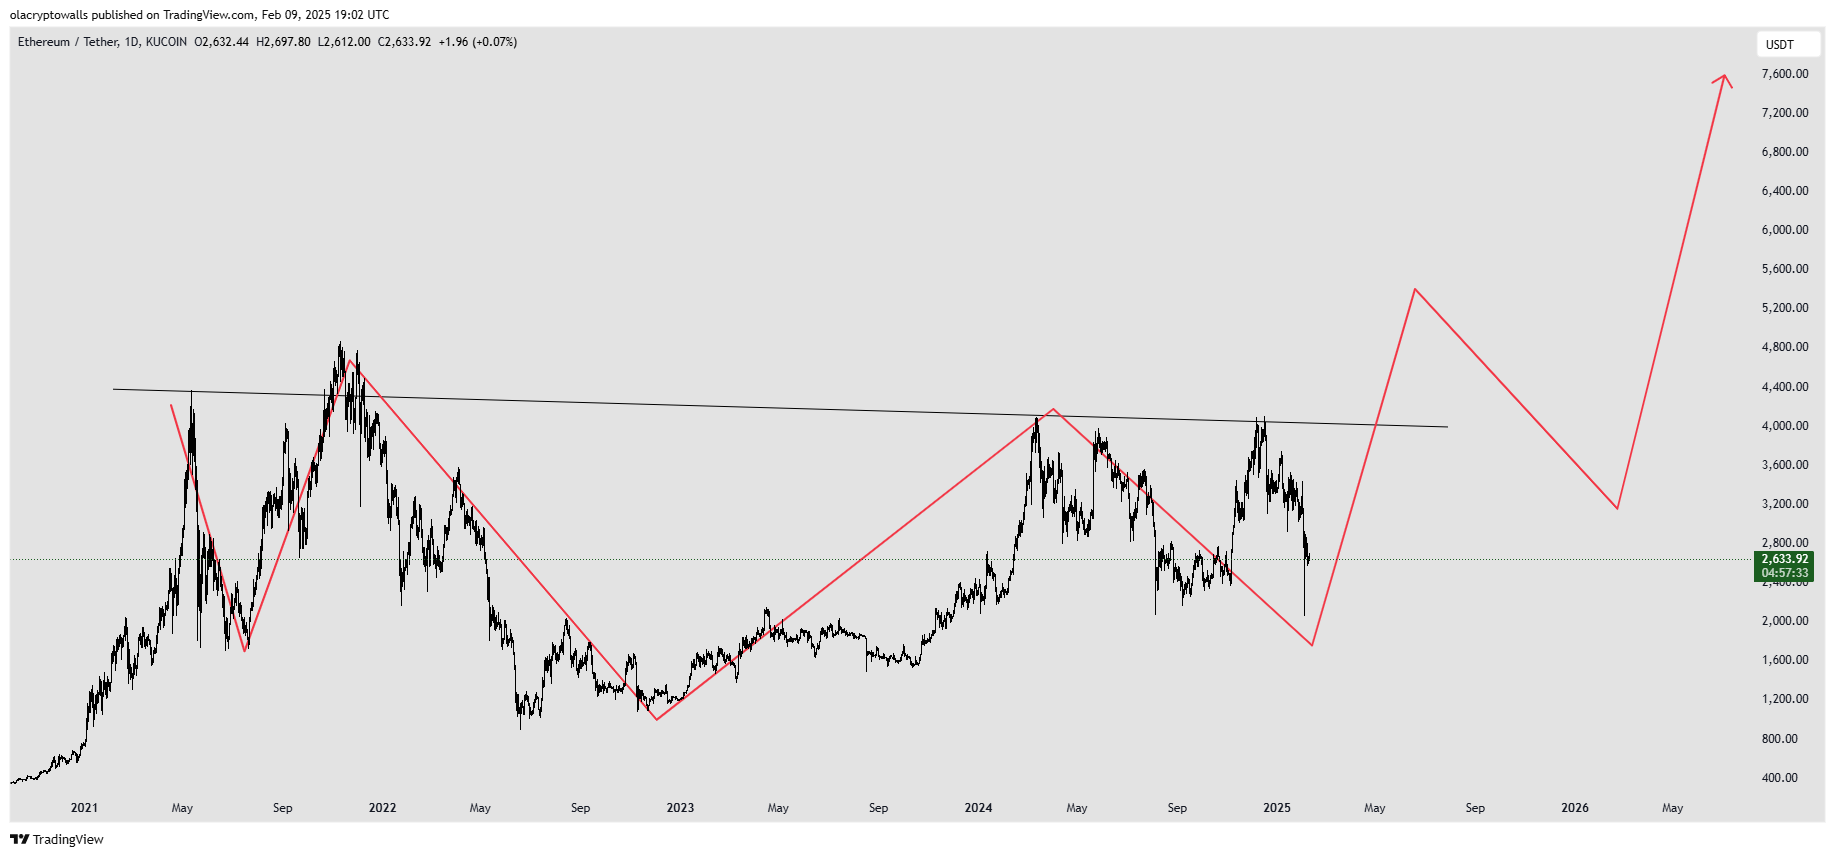
Ethereum might drop to $1,600 to complete the pattern’s right shoulder before a reversal happens. However, this still does not fully indicate an Ethereum reversal, as the price would need to break the neckline ($4,000 resistance). If it does, there will probably be a retest before a run up to $7,300.
Ethereum 4-HR Chart
When zooming in, one notices a different sentiment on the 4-HR timeframe.
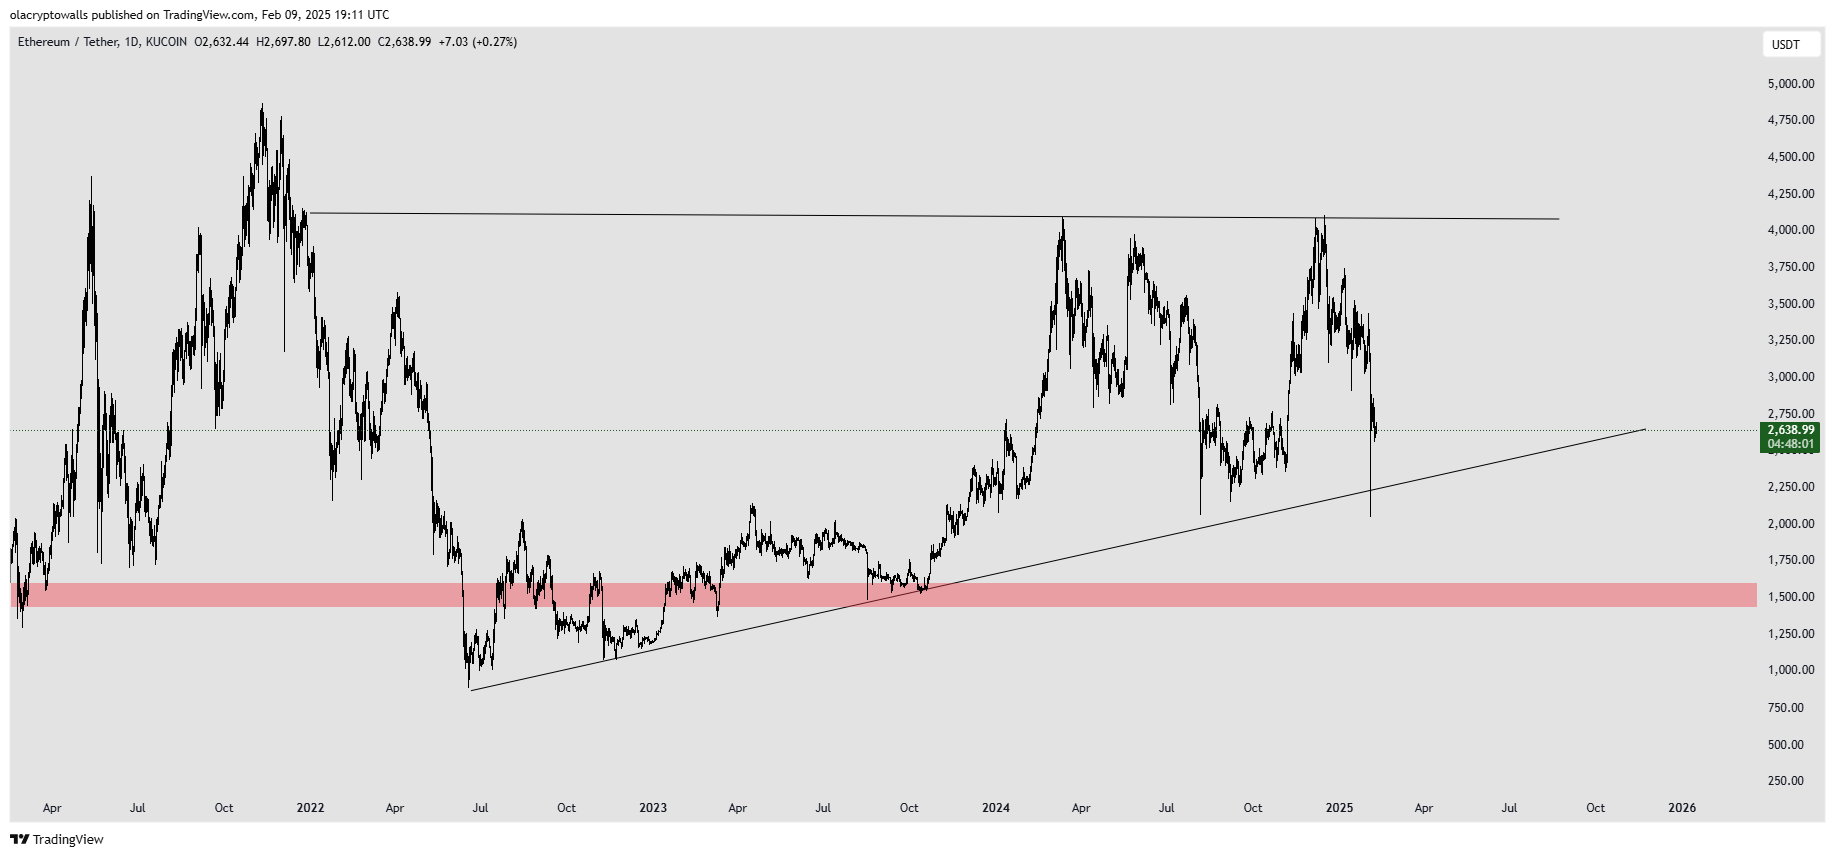
The Ethereum price chart shows an ascending triangle, with prices around the support trend line. Ethereum might hover around the support before bouncing up.
Still, the $4,000 resistance remains valid, and all bullish momentum will be tested at this level. The support is $1,600, and if Ethereum can close outside the trendline on the 4HR chart, it could definitely touch the $1,600 zone.
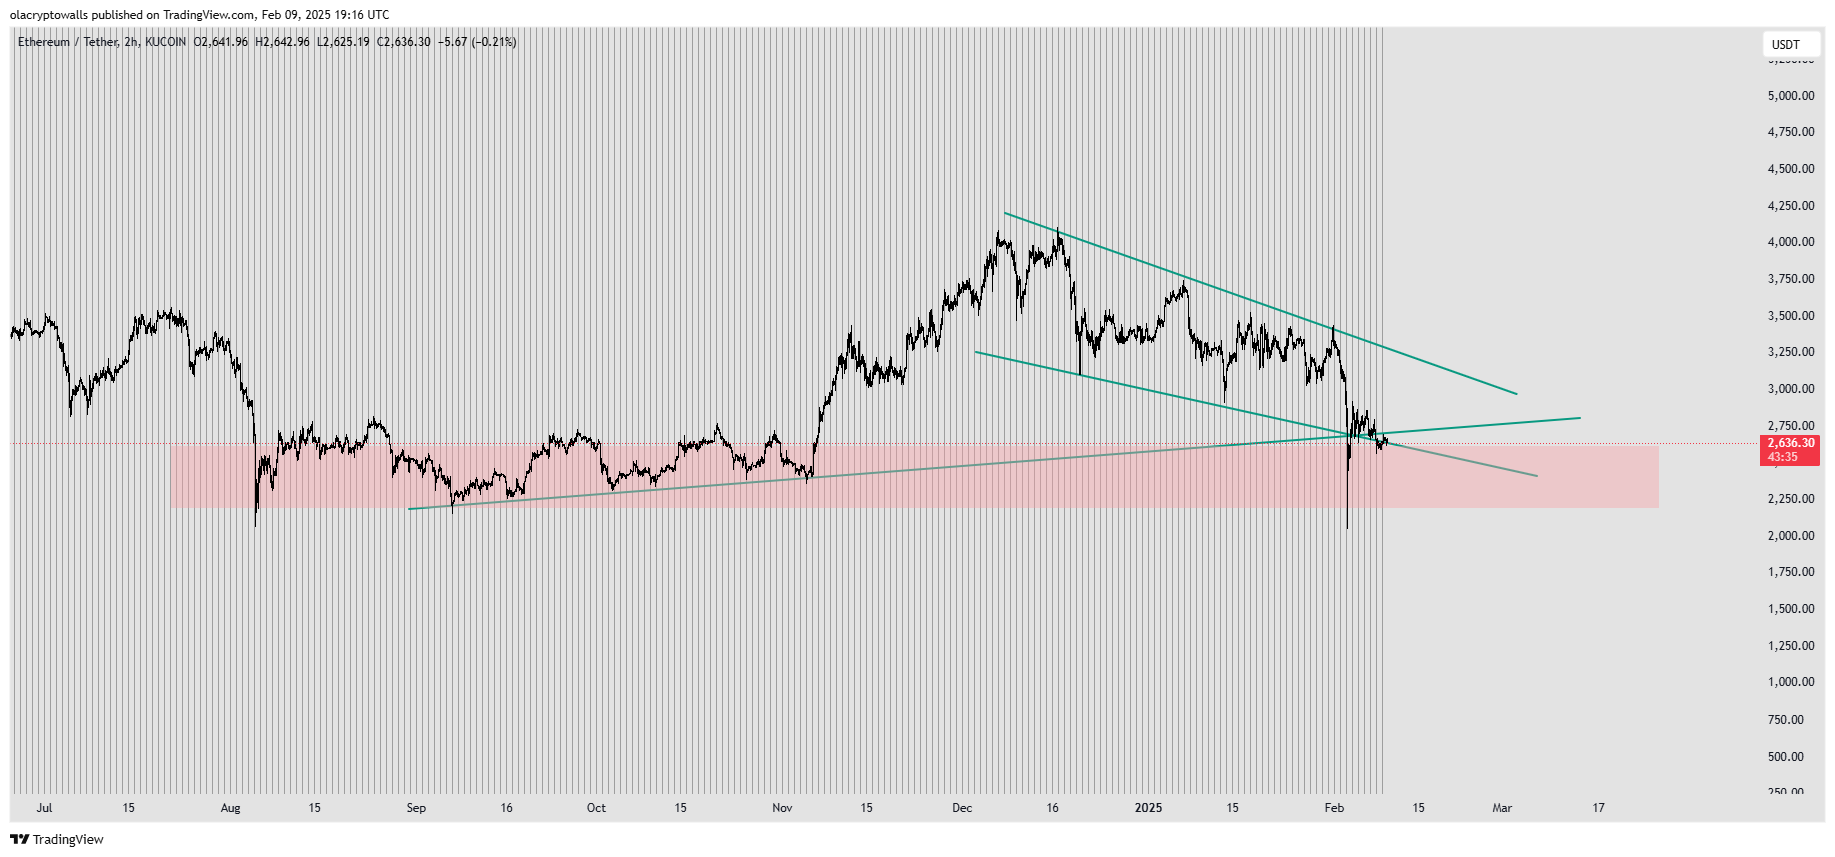
Ethereum 1-HR Chart
On the 1HR chart, Bulls will need a catalyst to effect a jump up. A series of lower highs and lower lows have sentenced Ethereum outside the trend line. The area of interest is the $2,500 to $2,100 zone.
If the bears can prevail here, Ethereum will slide down to $1,600 before any hope of a reversal happens.
READ MORE: Former Binance CEO Initiates Community Vote Over MEV On-Chain Issues