


The price of Sui has gone parabolic this month as the crypto market has recovered. It jumped to a high of $4.28, marking its highest level since January 24 and an increase of 133% from its lowest point in April. If this trend continues, the Sui token is likely to jump to $5 in this bull cycle. This article explains why Aptos (APT) offers better value.
Why Aptos is Better than Sui
Aptos and Sui are popular layer-2 networks slowly gaining market share in the crypto market. When comparing key metrics, they are relatively similar. For example, they are both highly dilutive because of their monthly token unlocks. Sui’s unlock will end in 2030, while Aptos will end in 2032.
The other similarity is that they have an almost equal number of DeFi applications. Sui has 63 dApps that DeFi Llama tracks, while Aptos has 57. As a result, Sui has a total value locked (TVL) of over $2.84 billion, while Aptos has $1.63 billion.
Stablecoins are the default currencies used in the blockchain industry. As such, a network with more stablecoins is better because it signals that it has more activity. Sui has over $885 million in stablecoins, while Aptos has $1.14 billion.
Because of its growing meme coin activity, Sui has more decentralized exchange (DEX) industry activity than Aptos. The network’s protocols handled over $500 million in assets, compared to Aptos’ $95 million.
This fundamental comparison reveals that while Sui outperforms Aptos in certain areas, Aptos holds the advantage in others. The main differences between the two are not significant.
However, Aptos and Sui prices have diverged. While the price of Sui has increased by 300% over the last 12 months, the price of Aptos has decreased by 30% during the same period. Also, technical indicators suggest that Aptos has more room to rise.
Aptos Price Technical Analysis
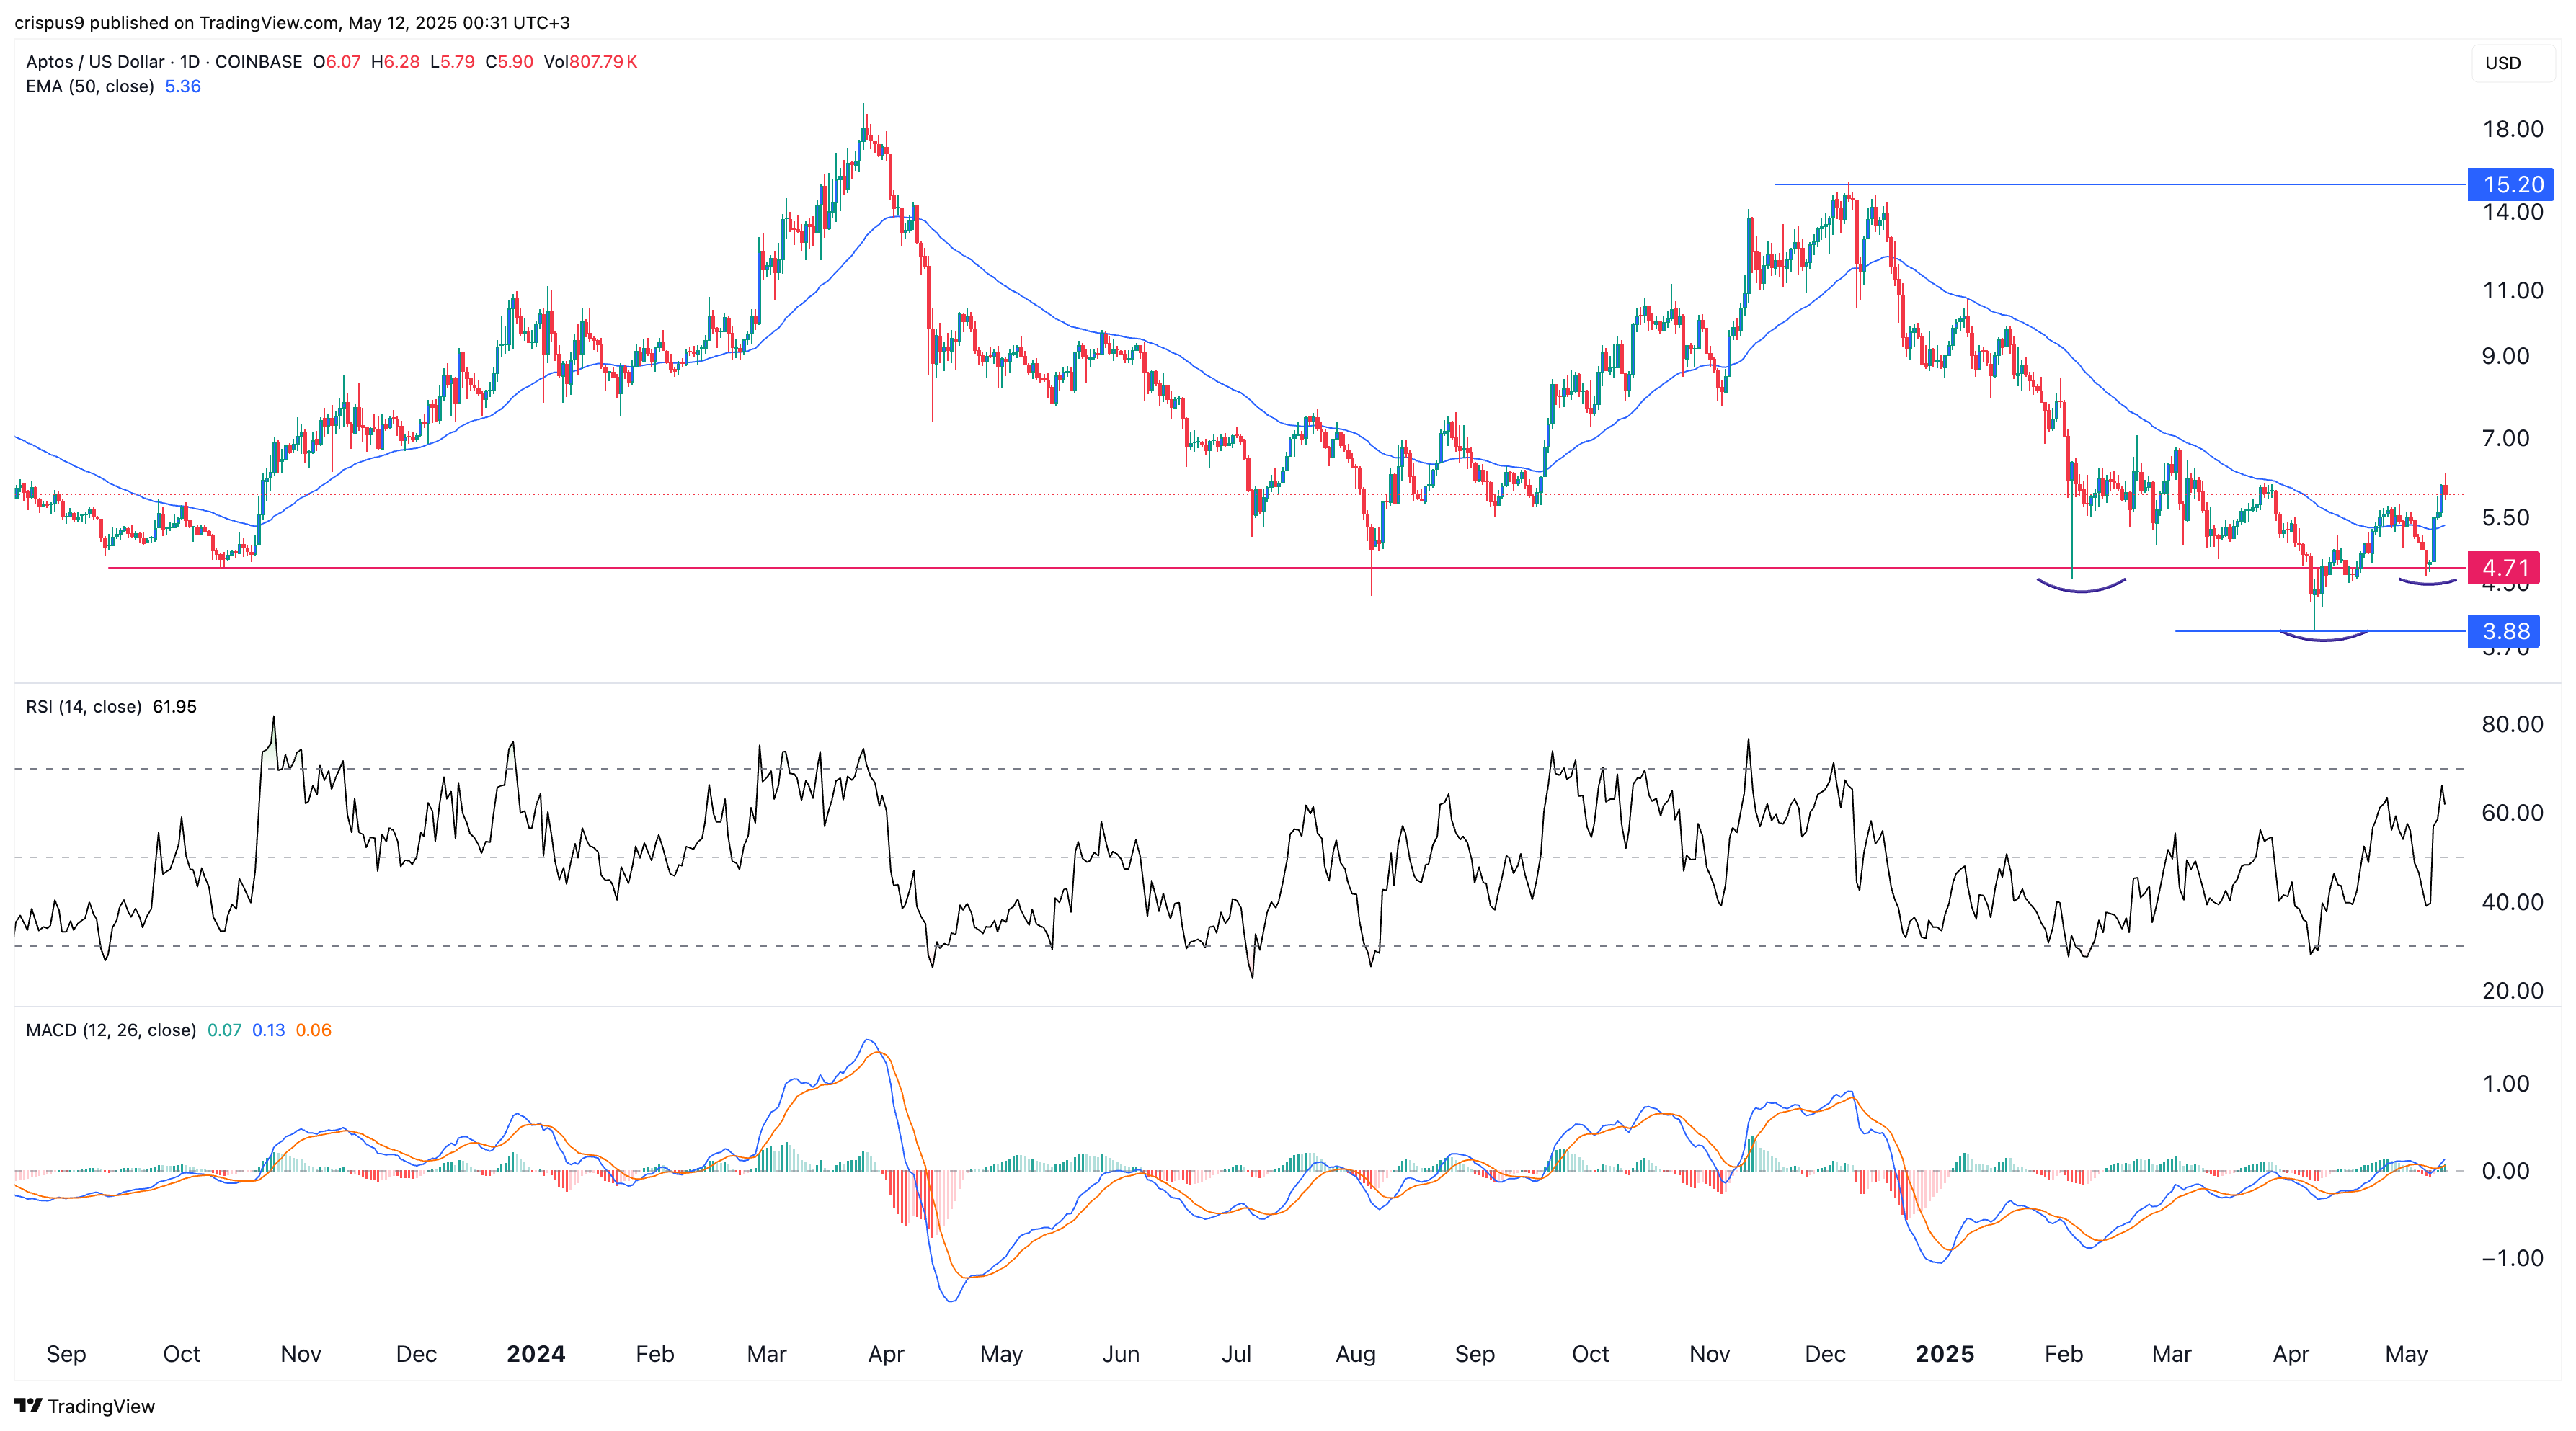
The daily chart shows that the APT price has bounced back after bottoming at $3.8 in April. It has already crossed the important resistance level at $4.7, the lowest swing on February 3, August 6 last year, and October 2023.
The coin has formed an inverse head and shoulders pattern, a common reversal sign. Also, the Relative Strength Index (RSI) has pointed upwards and is nearing overbought at 70.
Most notably, the MACD indicator has formed a bullish divergence and has already crossed the zero line. The coin will likely continue rising, with bulls targeting the key resistance level at $15.20, about 157% above its current level and the highest swing on December 4.
Sui Price Technical Analysis
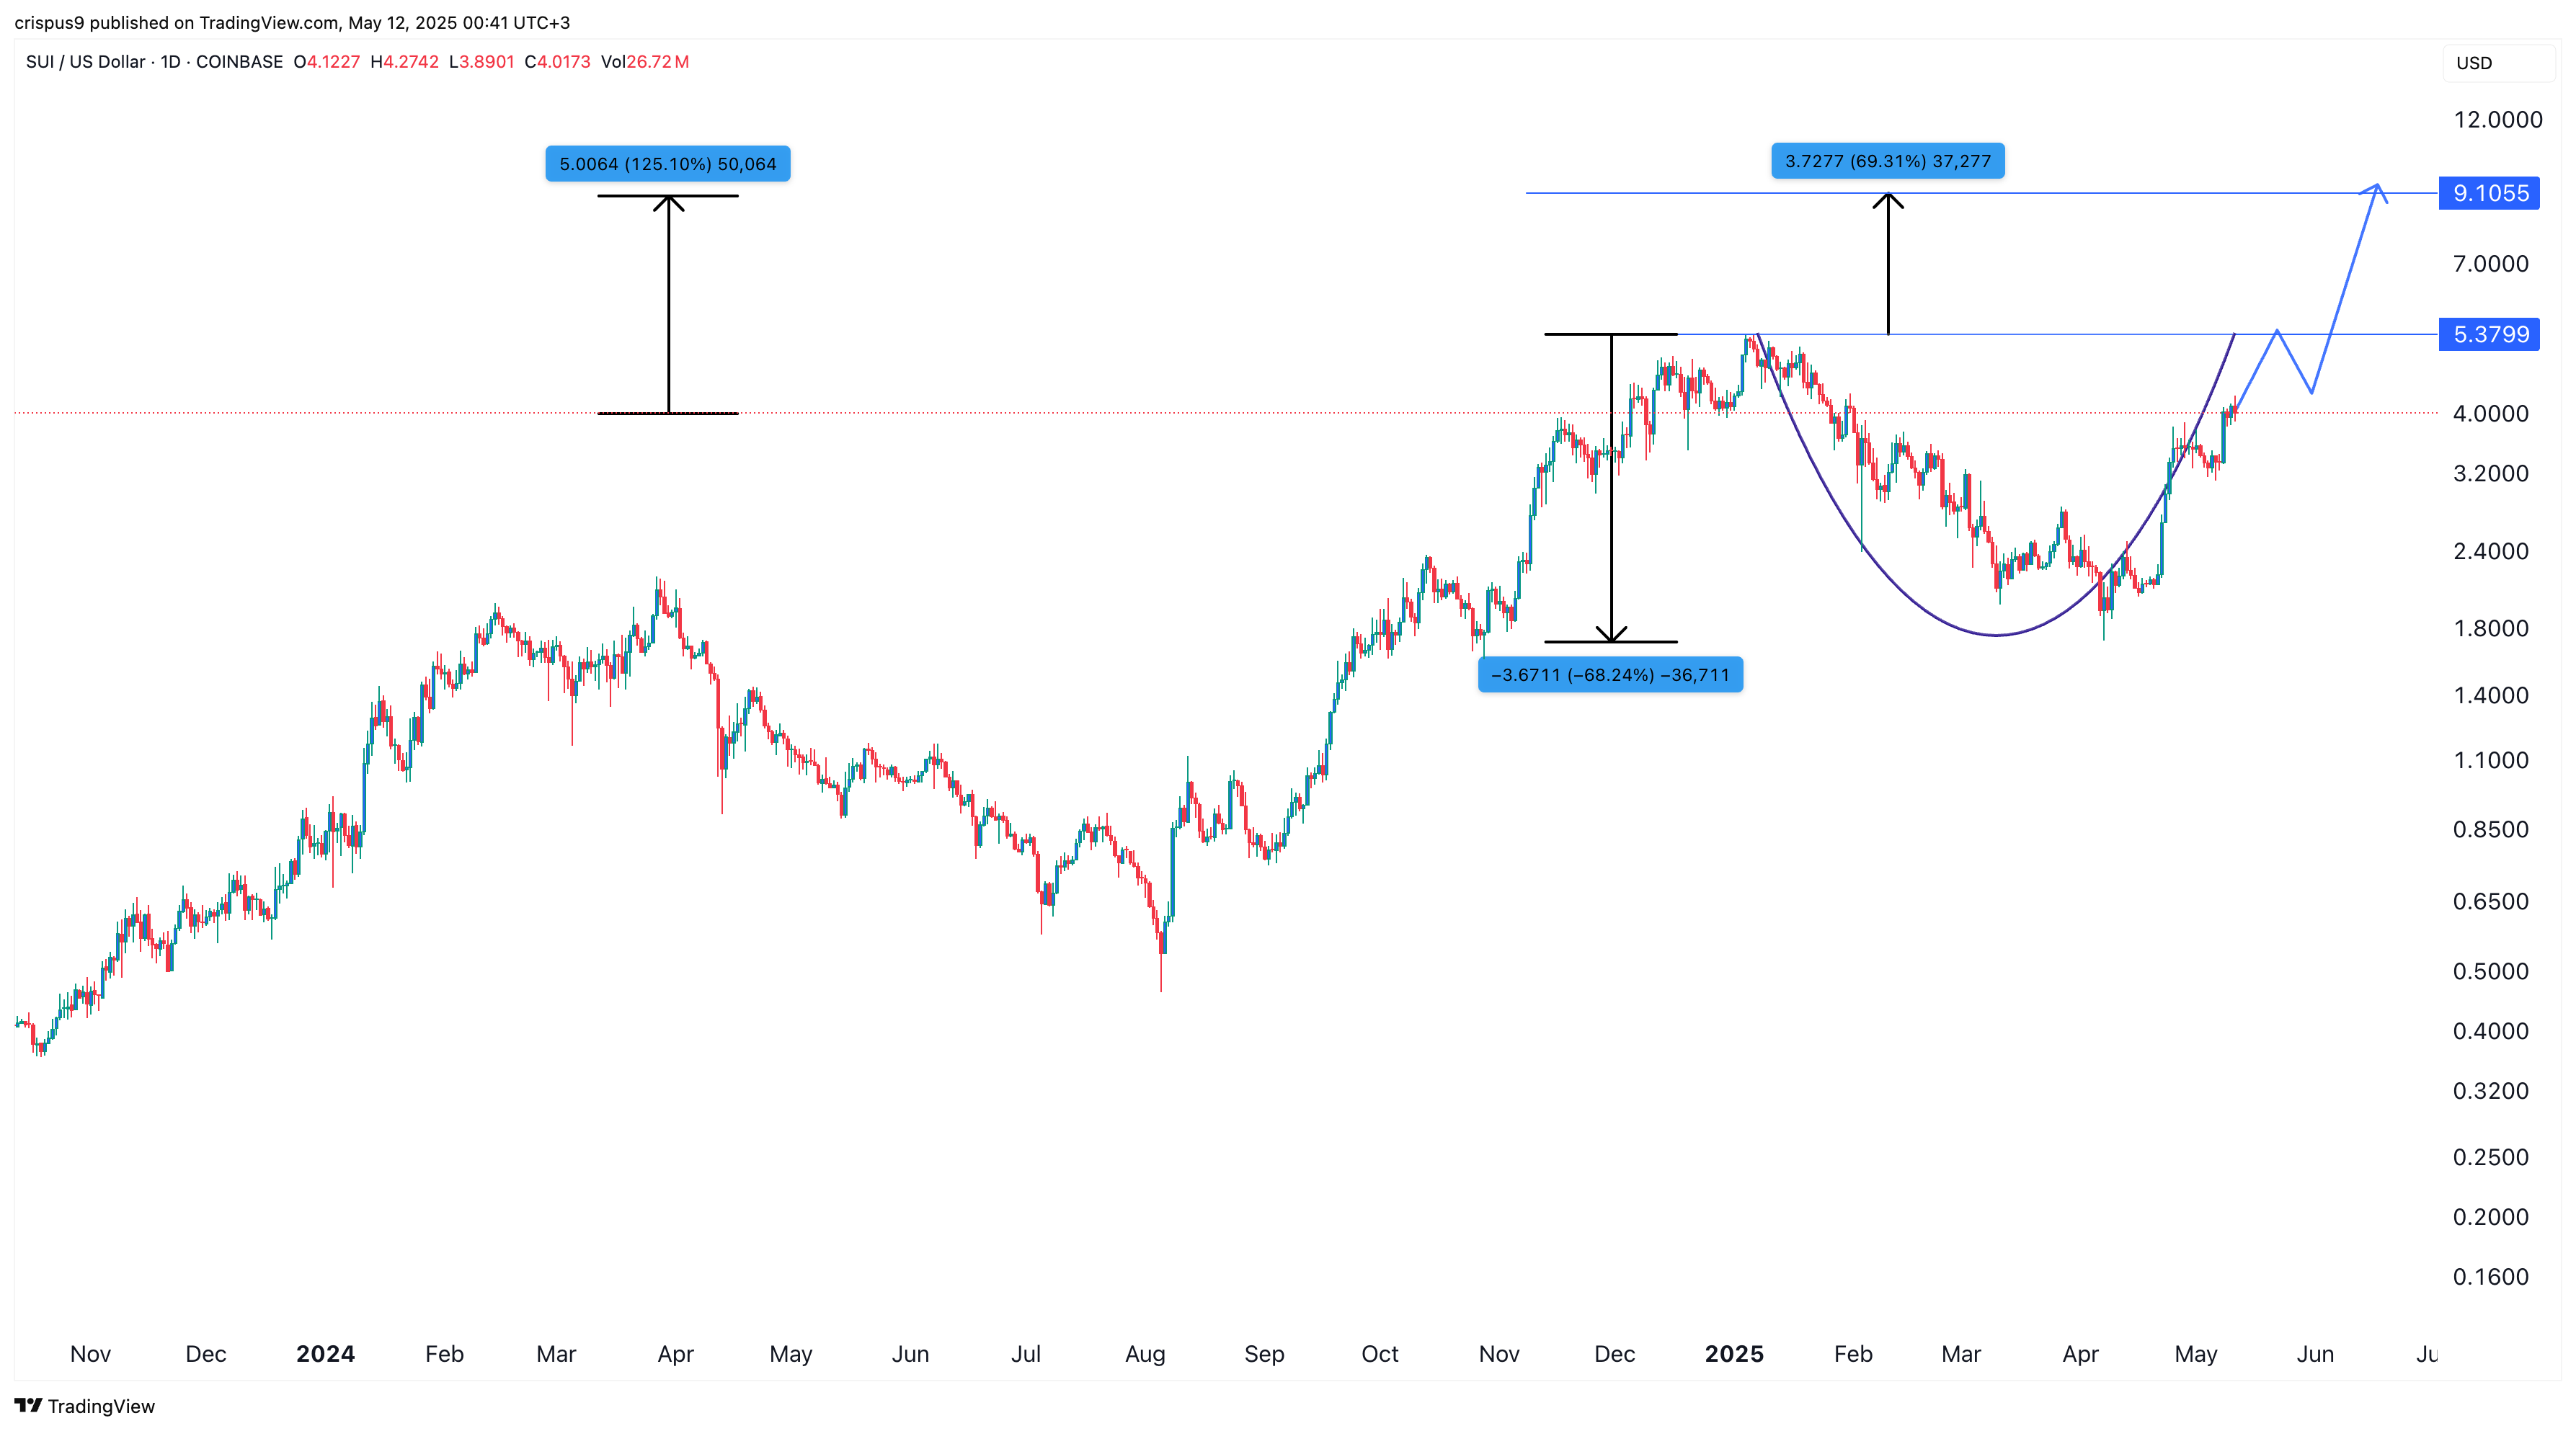
The daily chart shows that the Sui price is slowly forming a cup and handle pattern, with its upper side at its all-time high of $5.37. The pattern has a depth of about 68%, and as such, measuring the same distance from its upper side brings the target price to $9.
A move from $4 to $9 represents a 125% increase, suggesting that Aptos may be a more advantageous investment at the current level.