


Raydium Coin (RAY), the Solana-based DeFi protocol token, surged over 20% in the past 24 hours, trading around $3.79–$3.80. This rally pushed its market cap to $1.1 billion, with trading volume rocketing to over $204.9 million, a nearly 57% increase.
However, multiple technical indicators, chart patterns, and analyst commentaries now suggest the Raydium price may be gearing up for a significant breakout.
RAY Coin Forms a Bullish Rounding Bottom Pattern
Crypto analyst Ijaz Awan shared his bullish outlook on Twitter, identifying a “rounding bottom” pattern on RAY’s daily chart. This pattern, known for signaling long-term reversals, has a neckline at $4.20.
Awan wrote:
“If it can make its way to the neckline, I see a path to $7 range, more than doubling from the current range.”
The chart shows a clear accumulation zone and rounded consolidation. This type of base-building often precedes significant breakouts. The $4.20 neckline now becomes the next crucial resistance level. A confirmed break above it could trigger a parabolic move.
Although optimism is rising, some analysts maintain a cautious outlook. In another tweet (Chart 4), technical analyst Nology warns that the RAY Coin is approaching a “critical zone of rejection”, a range from $4.20 to $5.00, suggesting potential price resistance.
The trader warns that a failure to rise could lead to a significant price drop. However, analysts suggest that if RAY successfully rises above $5, technical indicators predict a potential rise to $17 or even $20.
He views Raydium as undergoing a shallow Wave 2, a technical term from Elliott Wave Theory indicating the potential start of a larger upward trend. The tweet also mentions that time-based Fibonacci projections line up around August, hinting that the next two months may define RAY’s longer-term direction.
Raydium Price Chart Confirms a Technical Breakout
CentralCharts data shows that the Raydium token recently closed at $3.80, comfortably above its 50-day and 100-day moving averages, currently at $2.34 and $2.85, respectively. This movement alone is a notable sign of growing strength.
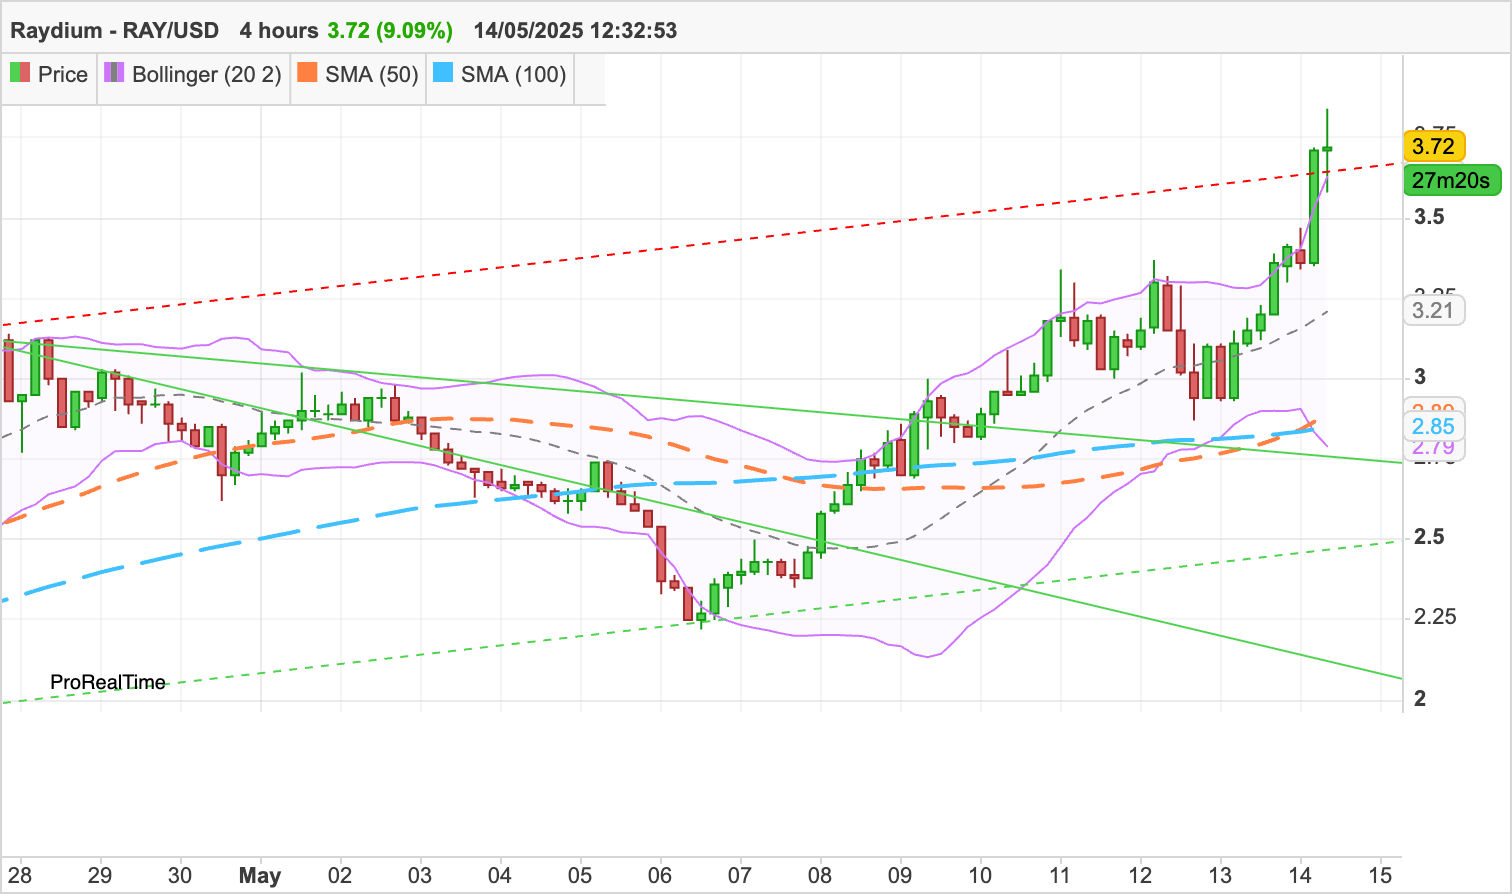
Further supporting the bullish case, the RAY Coin has climbed past the Bollinger average of $2.89 and even pierced the upper Bollinger Band at $3.52. This kind of move often reflects increased buying pressure and rising volatility, characteristics commonly seen during the early stages of a trend reversal.
Looking ahead, the first major resistance lies at $4.20, a level identified as the neckline of a potential rounded bottom formation. If the price can break above this threshold with convincing volume, it could begin a sustained upward trend.
The $5 mark follows closely as a psychological and technical barrier. Crossing this level may indicate potential for significant gains, possibly extending to double digits.
READ MORE: Solana Price Eyes $195 as Bullish Structure Strengthens — Can $250 Be Next?