


The XRP price may be on the verge of a strong bullish breakout as a recently launched exchange-traded fund (ETF) continues firing on all cylinders. Ripple is trading at $2.5 on Thursday, up 60% from its lowest point this year.
XXRP ETF Assets are Soaring
One of the top bullish catalysts for the XRP price this year has been the rising optimism that the SEC will ultimately approve spot ETFs by companies like Bitwise, Franklin Templeton, VanEck, and Canary.
As Ethereum ETFs have shown, approving an ETF is one thing, and getting inflows from Wall Street investors is another. Since their approval in September, all spot ETH ETFs have had less than $2.5 billion in inflows. In contrast, spot Bitcoin ETFs have had over $41 billion, which explains why their performance has improved.
JPMorgan analysts estimate that all spot XRP ETFs will have at least $8 billion inflows within the first year. They noted that, unlike Ethereum, XRP has staking, meaning that the expense ratio will be the only cost of holding its funds.
Investors interested in Ethereum can buy and stake their coins through Coinbase and generate a 3% return. Coinbase is the custodian for most ETH ETFs.
The Teucrium 2x Long Daily XRP ETF (XXRP) demonstrates demand for XRP assets. That’s because it has already accumulated $117 million worth of assets less than two months after launch.
READ MORE: XRP Price Can’t Hit $100 by 2030: Here’s a More Realistic Prediction
These are more assets than one would have expected because of their costs. While most ETFs charge less than 0.50% a year, the XXRP ETF has an expense ratio of 1.89%. This means an investor with $10,000 will pay an annual fee of $189. An investor with a similar amount in the Grayscale Mini Bitcoin ETF (BTC) pays just $15.
The XXRP ETF is more expensive than other leveraged ETFs. For example, the PoShares UltraPro QQQ (TQQQ) ETF has a ratio of 0.88%, while the ProShares Ultra S&P 500 (SSP) has 0.90%.
Therefore, if investors are willing to pay such a high fee, it suggests that spot XRP ETFs are also likely to receive more inflows, as their expense ratios will be lower.
XRP Price Technical Analysis
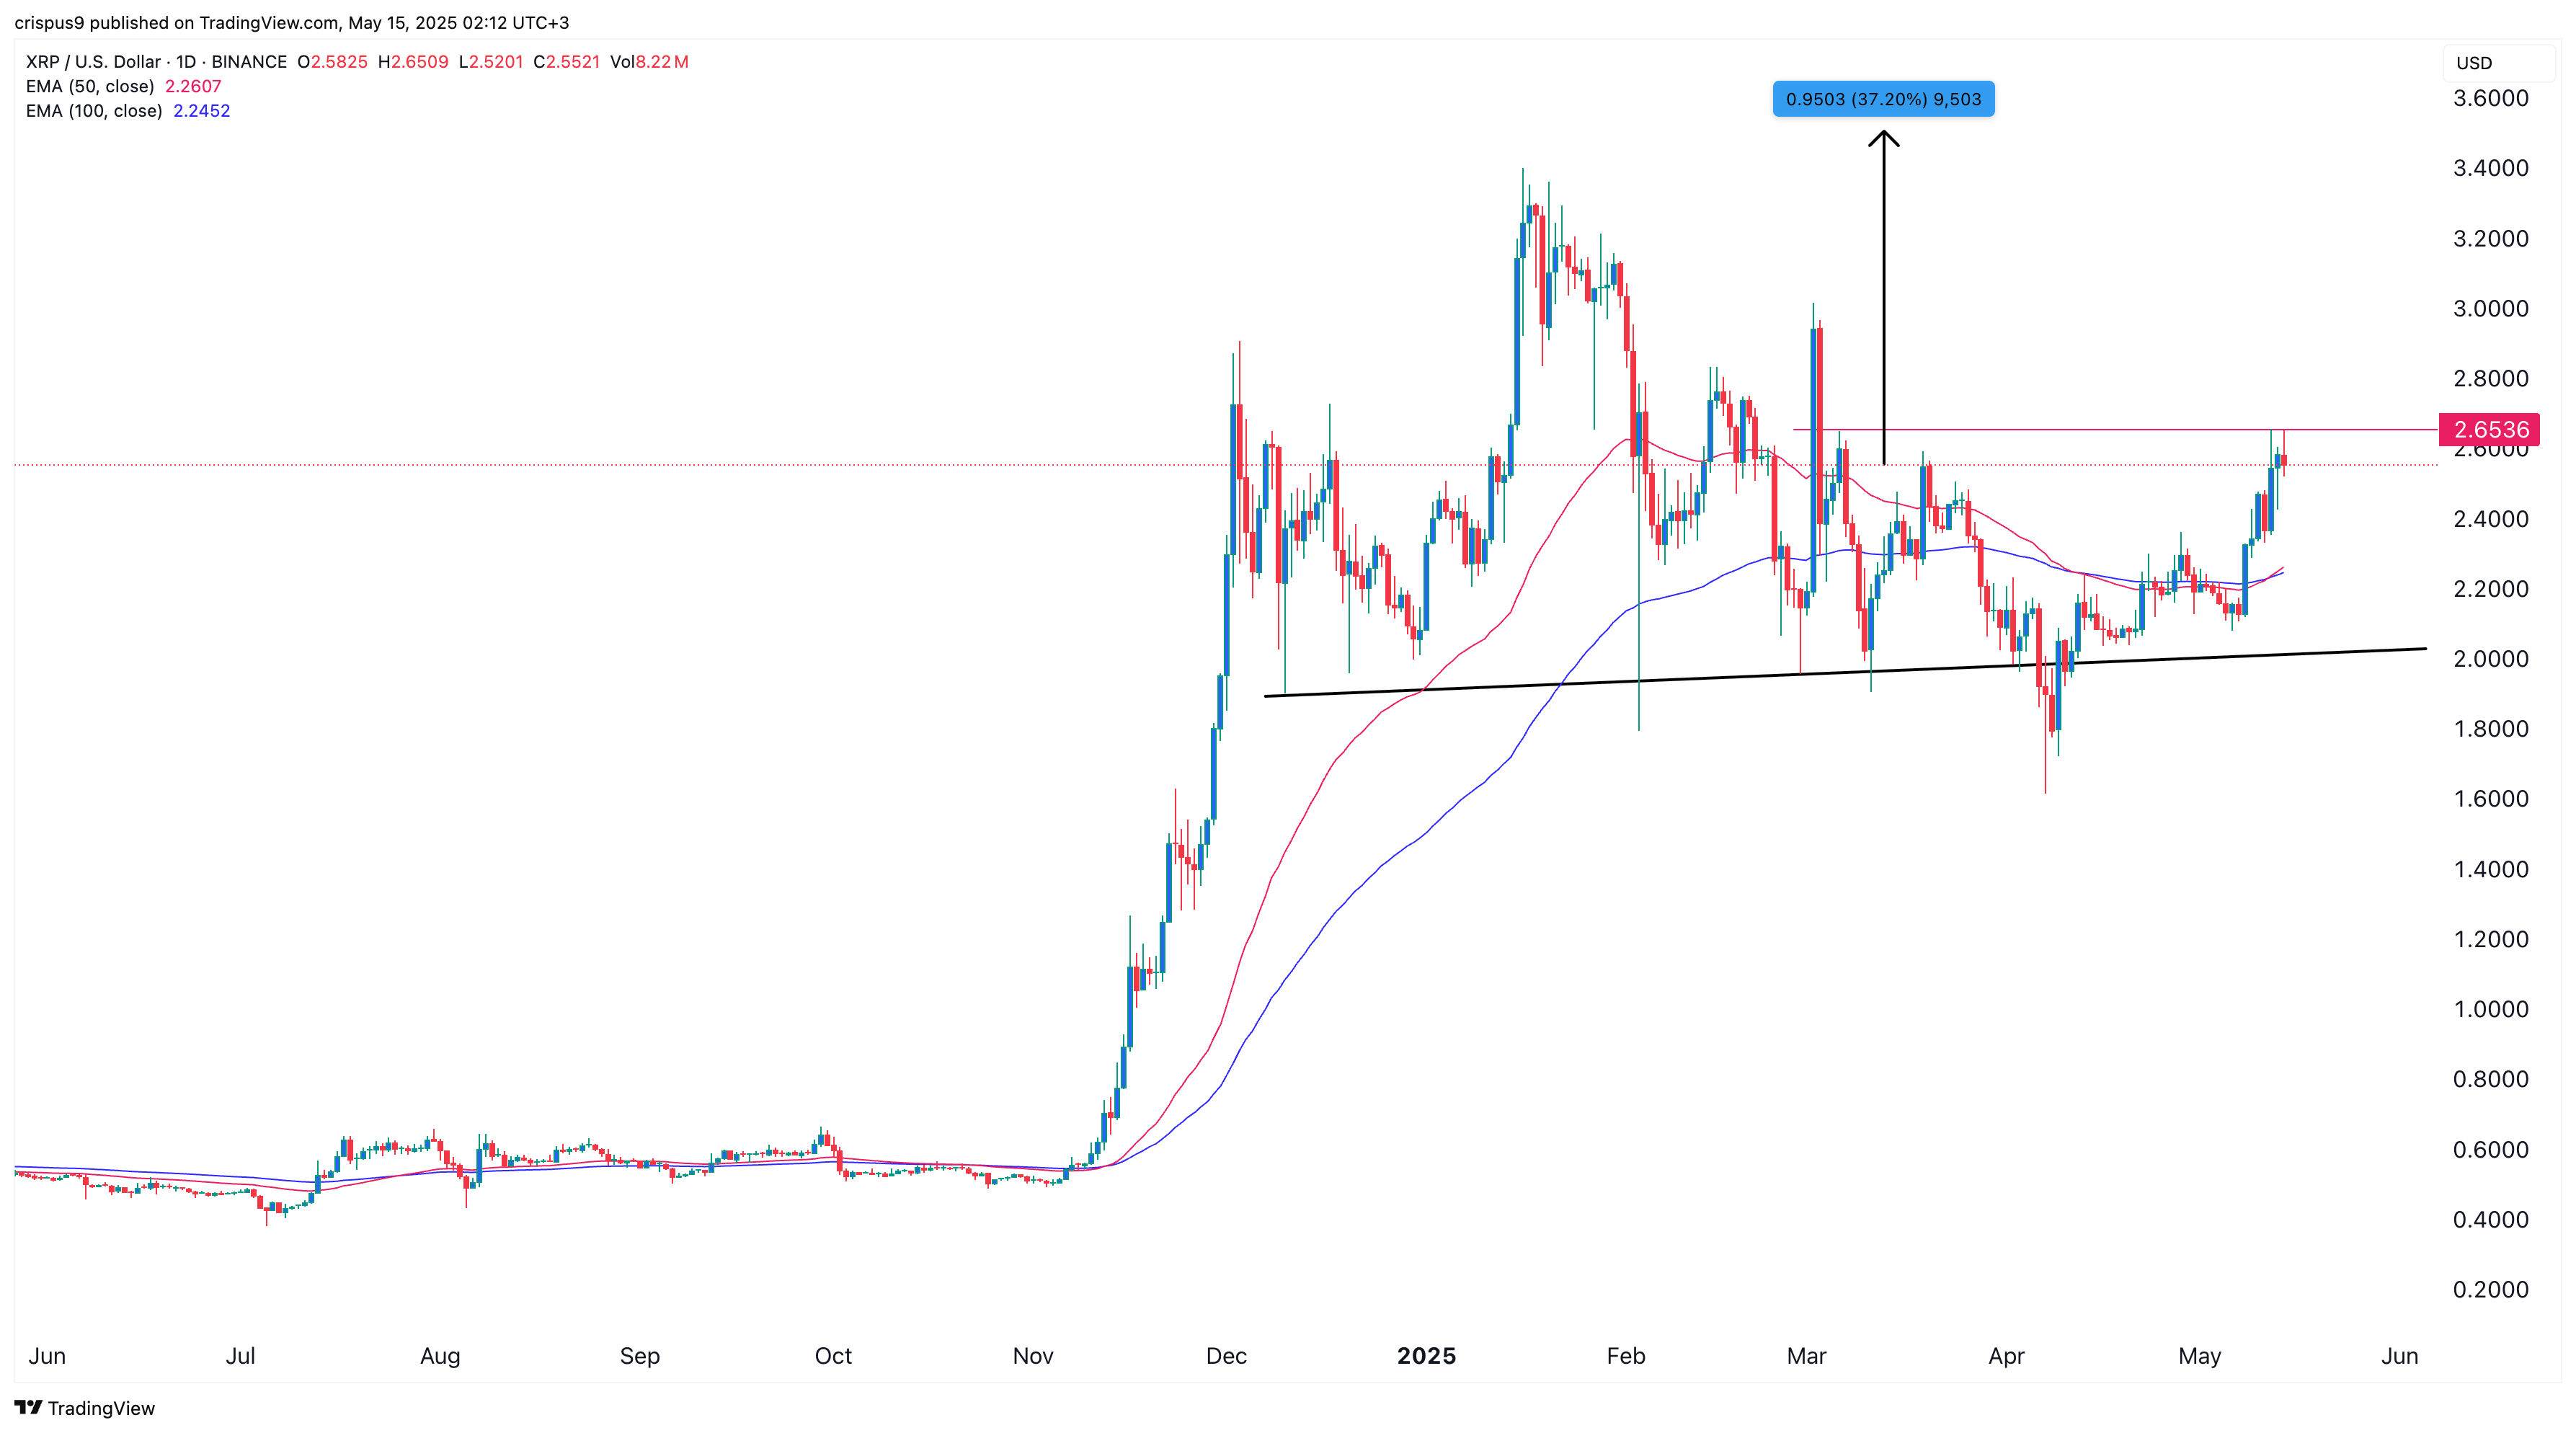
The daily chart shows that the XRP price has experienced a strong bullish breakout in the past few days. It has jumped to a high of $2.6535, reaching its highest point since March 4.
Ripple’s price has formed an inverse head-and-shoulders pattern. It has also moved above the 100-day and 50-day Exponential Moving Averages (EMA), which have made a bullish crossover pattern.
The Relative Strength Index (RSI) and the Percentage Price Oscillator (PPO) have all pointed upwards. Therefore, the token will likely keep rising as bulls target the key resistance level at $3.5, up by 37% above the current level. A drop below the support at $2.4 will invalidate the bullish outlook.
READ MORE: Just $130 Million SHIB Coins? Will Shiba Inu Price Rise or Crash?